37 Hemlock St Braintree, MA 02184
South Braintree NeighborhoodEstimated Value: $634,000 - $707,000
About This Home
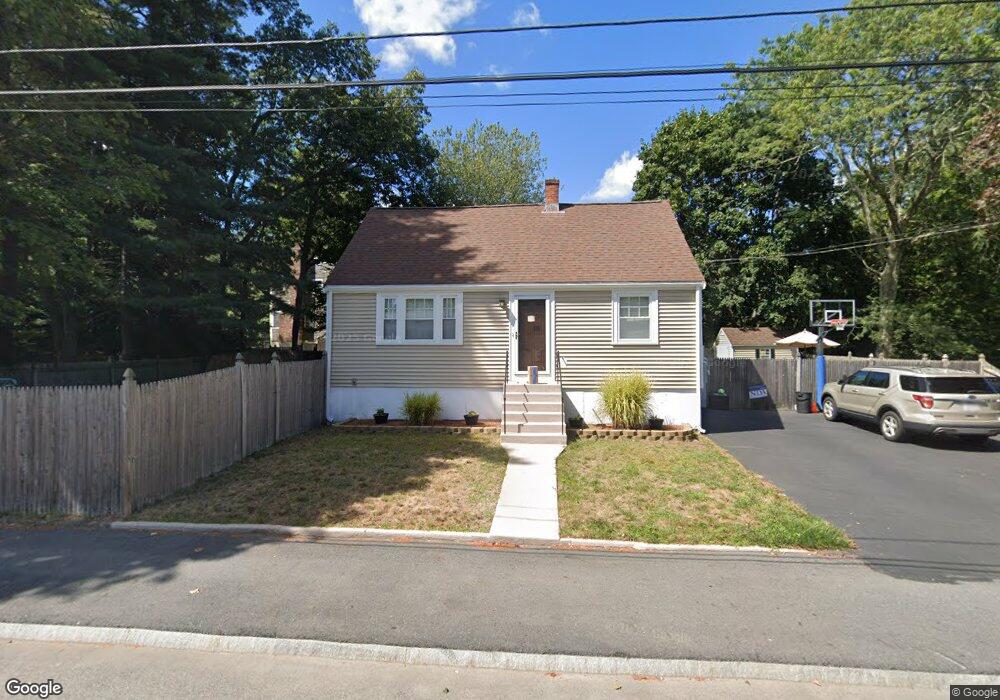
This home is located at 37 Hemlock St, Braintree, MA 02184 and is currently estimated at $683,816, approximately $508 per square foot. 37 Hemlock St is a home located in Norfolk County with nearby schools including Braintree High School, First Baptist Christian School, and Thayer Academy.
Ownership History
We collect this data history from publicly available records. To have your information removed, we recommend requesting removal directly through your county’s website.
Purchase Details
Home Financials for this Owner
Home Financials are based on the most recent Mortgage that was taken out on this home.Purchase Details
Home Values in the Area
Average Home Value in this Area
Purchase History
We collect this data history from publicly available records. To have your information removed, we recommend requesting removal directly through your county’s website.
| Date | Buyer | Sale Price | Title Company |
|---|---|---|---|
| $178,750 | -- | ||
| $142,500 | -- | ||
| $142,500 | -- |
Mortgage History
We collect this data history from publicly available records. To have your information removed, we recommend requesting removal directly through your county’s website.
| Date | Status | Borrower | Loan Amount |
|---|---|---|---|
| Open | $300,000 | ||
| Closed | $190,000 | ||
| Closed | $169,800 |
Tax History
We collect this data history from publicly available records. To have your information removed, we recommend requesting removal directly through your county’s website.
| Year | Tax Paid | Tax Assessment Tax Assessment Total Assessment is a certain percentage of the fair market value that is determined by local assessors to be the total taxable value of land and additions on the property. | Land | Improvement |
|---|---|---|---|---|
| 2025 | $6,189 | $620,100 | $355,300 | $264,800 |
| 2024 | $5,526 | $582,900 | $322,500 | $260,400 |
| 2023 | $5,232 | $536,100 | $289,800 | $246,300 |
| 2022 | $5,056 | $508,100 | $261,800 | $246,300 |
| 2021 | $4,594 | $461,700 | $236,500 | $225,200 |
| 2020 | $4,340 | $440,200 | $215,000 | $225,200 |
| 2019 | $4,162 | $412,500 | $205,700 | $206,800 |
| 2018 | $4,062 | $385,400 | $187,000 | $198,400 |
| 2017 | $3,947 | $367,500 | $177,600 | $189,900 |
| 2016 | $3,872 | $352,600 | $168,300 | $184,300 |
| 2015 | $3,515 | $317,500 | $140,200 | $177,300 |
| 2014 | $3,403 | $298,000 | $134,600 | $163,400 |
Map
- 894 Liberty St Unit 10
- 894 Liberty St Unit 6
- 23 Portland Rd
- 37 Old Coach Rd
- 117 Alida Rd
- 85 Celia Rd
- 422 John Mahar Hwy Unit 103
- 414 John Mahar Hwy Unit 209
- 414 John Mahar Hwy Unit 303
- 20 Teaberry Ln Unit 1
- 20 Cherry Ln
- 56 Plain St
- 62 Fountain St
- 590 Liberty St
- 501 Commerce Dr Unit 2204
- 501 Commerce Dr Unit 308
- 501 Commerce Dr Unit 2105
- 501 Commerce Dr Unit 4308
- 501 Commerce Dr Unit 3119
- 501 Commerce Dr Unit 3113
Ask me questions while you tour the home.