D
Landlord's Agent in 2020
David Picardy
Liberty Residential Realty, LLC
Estimated Value: $270,000 - $338,000
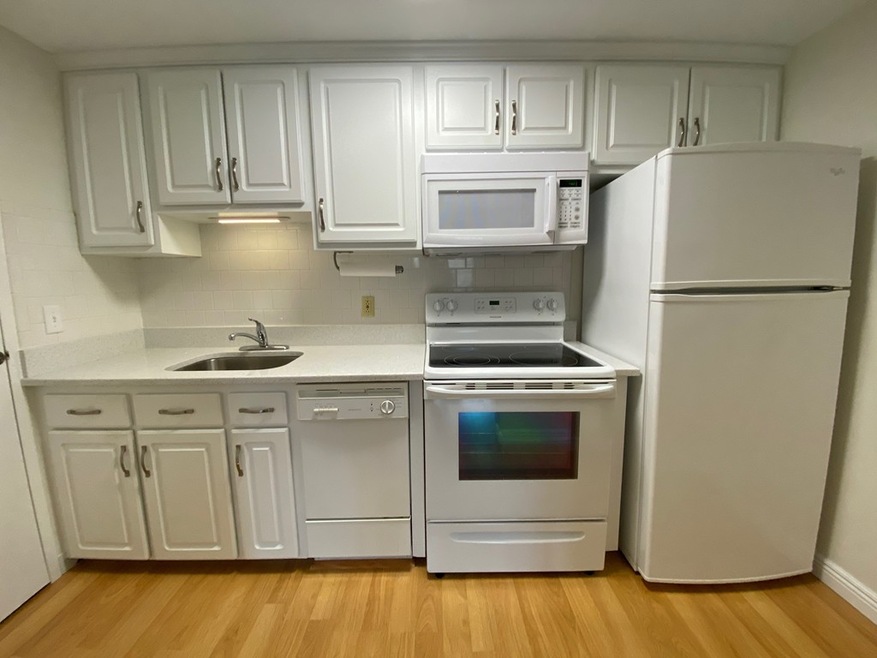
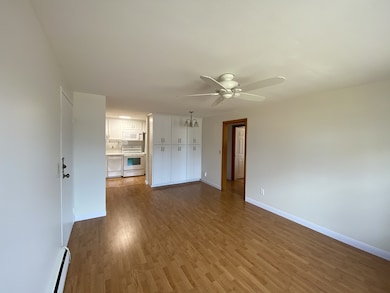
Holten Gardens condo community unit for rent! 2 bedroom with open concept living/dining/kitchen. Laminate flooring throughout. Private access to Danvers rail trail. Only a couple blocks from downtown. Heat & Hot water included. 3rd floor unit. 1 car deeded parking with plenty of visitor parking. First/Security & 1/2 Fee
Last Agent to Rent the Property
David Picardy
Liberty Residential Realty, LLC Listed on: 02/06/2020
Last Renter's Agent
David Picardy
Liberty Residential Realty, LLC Listed on: 02/06/2020
| Date | Buyer | Sale Price | Title Company |
|---|---|---|---|
| Linda B Pollack Ft | $220,500 | None Available |
| Date | Event | Price | List to Sale | Price per Sq Ft | Prior Sale |
|---|---|---|---|---|---|
| 02/27/2020 02/27/20 | Rented | $1,795 | 0.0% | -- | |
| 02/19/2020 02/19/20 | Under Contract | -- | -- | -- | |
| 02/06/2020 02/06/20 | For Rent | $1,795 | 0.0% | -- | |
| 01/09/2020 01/09/20 | Sold | $220,500 | -4.1% | $356 / Sq Ft | View Prior Sale |
| 12/11/2019 12/11/19 | Pending | -- | -- | -- | |
| 12/07/2019 12/07/19 | For Sale | $230,000 | -- | $371 / Sq Ft |
| Year | Tax Paid | Tax Assessment Tax Assessment Total Assessment is a certain percentage of the fair market value that is determined by local assessors to be the total taxable value of land and additions on the property. | Land | Improvement |
|---|---|---|---|---|
| 2025 | $3,224 | $293,400 | $0 | $293,400 |
| 2024 | $3,110 | $279,900 | $0 | $279,900 |
| 2023 | $2,746 | $233,700 | $0 | $233,700 |
| 2022 | $2,699 | $213,200 | $0 | $213,200 |
| 2021 | $2,662 | $199,400 | $0 | $199,400 |
| 2020 | $2,242 | $171,700 | $0 | $171,700 |
| 2019 | $1,805 | $135,900 | $0 | $135,900 |
| 2018 | $1,984 | $146,500 | $0 | $146,500 |
| 2017 | $1,945 | $137,100 | $0 | $137,100 |
| 2016 | $1,860 | $131,000 | $0 | $131,000 |
| 2015 | $1,440 | $96,600 | $0 | $96,600 |
D
Landlord's Agent in 2020
David Picardy
Liberty Residential Realty, LLC
M
Seller's Agent in 2020
Marilyn Hazel
Century 21 North East
C
Buyer's Agent in 2020
Chris Blasczak
Liberty Residential Realty, LLC
Source: MLS Property Information Network (MLS PIN)
MLS Number: 72616543
APN: DANV-000051-000000-000014-C000010-C000010
Disclaimer: Certain information contained herein is derived from information provided by parties other than Homes.com. All information provided is deemed reliable, but is not guaranteed to be accurate and should be independently verified.
![]() The property listing data and information, or the Images, set forth herein were provided to MLS Property Information Network, Inc. from third party sources, including sellers, lessors and public records, and were compiled by MLS Property Information Network, Inc. The property listing data and information, and the Images, are for the personal, non-commercial use of consumers having a good faith interest in purchasing or leasing listed properties of the type displayed to them and may not be used for any purpose other than to identify prospective properties which such consumers may have a good faith interest in purchasing or leasing. MLS Property Information Network, Inc. and its subscribers disclaim any and all representations and warranties as to the accuracy of the property listing data and information, or as to the accuracy of any of the Images, set forth herein.
The property listing data and information, or the Images, set forth herein were provided to MLS Property Information Network, Inc. from third party sources, including sellers, lessors and public records, and were compiled by MLS Property Information Network, Inc. The property listing data and information, and the Images, are for the personal, non-commercial use of consumers having a good faith interest in purchasing or leasing listed properties of the type displayed to them and may not be used for any purpose other than to identify prospective properties which such consumers may have a good faith interest in purchasing or leasing. MLS Property Information Network, Inc. and its subscribers disclaim any and all representations and warranties as to the accuracy of the property listing data and information, or as to the accuracy of any of the Images, set forth herein.
