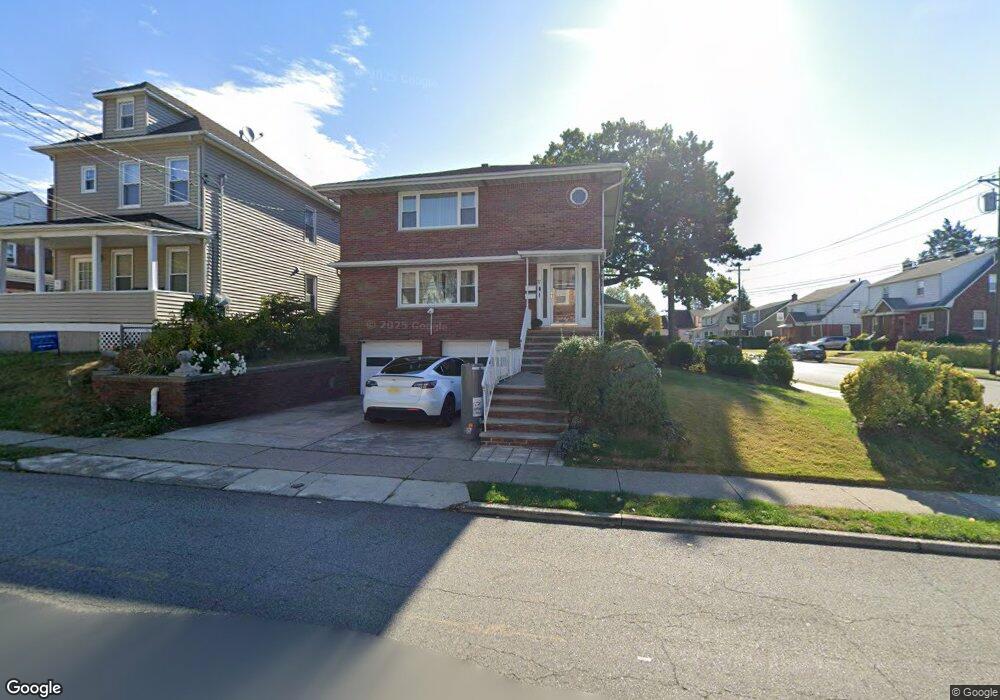
37 Huron Ave Clifton, NJ 07013
Athenia NeighborhoodEstimated Value: $724,919 - $863,000
Studio
--
Bath
2,790
Sq Ft
$282/Sq Ft
Est. Value
About This Home
This home is located at 37 Huron Ave, Clifton, NJ 07013 and is currently estimated at $786,980, approximately $282 per square foot. 37 Huron Ave is a home located in Passaic County with nearby schools including Clifton High School, St Andrew Elementary School, and Ybh Of Passaic-Hillel.
Ownership History
Date
Name
Owned For
Owner Type
Purchase Details
Closed on
Jan 30, 2019
Sold by
Zajac Stanislaw and Zajac Alicja
Bought by
Zajac Renata and Zajac Anna
Current Estimated Value
Purchase Details
Closed on
Dec 30, 1998
Sold by
Pilat John
Bought by
Zajac Stanislaw and Zajac Alicja
Home Financials for this Owner
Home Financials are based on the most recent Mortgage that was taken out on this home.
Original Mortgage
$200,000
Interest Rate
6.8%
Create a Home Valuation Report for This Property
The Home Valuation Report is an in-depth analysis detailing your home's value as well as a comparison with similar homes in the area
Home Values in the Area
Average Home Value in this Area
Purchase History
| Date | Buyer | Sale Price | Title Company |
|---|---|---|---|
| Zajac Renata | -- | None Available | |
| Zajac Stanislaw | $232,000 | Chicago Title Insurance Co |
Source: Public Records
Mortgage History
| Date | Status | Borrower | Loan Amount |
|---|---|---|---|
| Closed | Zajac Stanislaw | $200,000 |
Source: Public Records
Tax History
| Year | Tax Paid | Tax Assessment Tax Assessment Total Assessment is a certain percentage of the fair market value that is determined by local assessors to be the total taxable value of land and additions on the property. | Land | Improvement |
|---|---|---|---|---|
| 2025 | $14,187 | $239,000 | $83,600 | $155,400 |
| 2024 | $13,848 | $239,000 | $83,600 | $155,400 |
| 2022 | $13,647 | $239,000 | $83,600 | $155,400 |
| 2021 | $13,085 | $239,000 | $83,600 | $155,400 |
| 2020 | $13,128 | $239,000 | $83,600 | $155,400 |
| 2019 | $12,926 | $237,000 | $83,600 | $153,400 |
| 2018 | $12,853 | $237,000 | $83,600 | $153,400 |
| 2017 | $12,713 | $237,000 | $83,600 | $153,400 |
| 2016 | $12,466 | $237,000 | $83,600 | $153,400 |
| 2015 | $12,345 | $237,000 | $83,600 | $153,400 |
| 2014 | $12,092 | $237,000 | $83,600 | $153,400 |
Source: Public Records
Map
Nearby Homes
- 44 Liberty St
- 135 La Salle Ave
- 26 Major St
- 80 Major St
- 106 Speer Ave
- 144 Major St
- 90 Dick St
- 136 Martin Ave
- 147 Martin Ave
- 2 Ann St Unit 308
- 102 Scoles Ave
- 163 Willet St
- 56 Dawson Ave
- 9 Century Place
- 11 Century Place
- 76 Scoles Ave
- 16 Parkview Place
- 435 Van Houten Ave Unit 307
- 415 Mount Prospect Ave
- 48 8th Ave
Your Personal Tour Guide
Ask me questions while you tour the home.