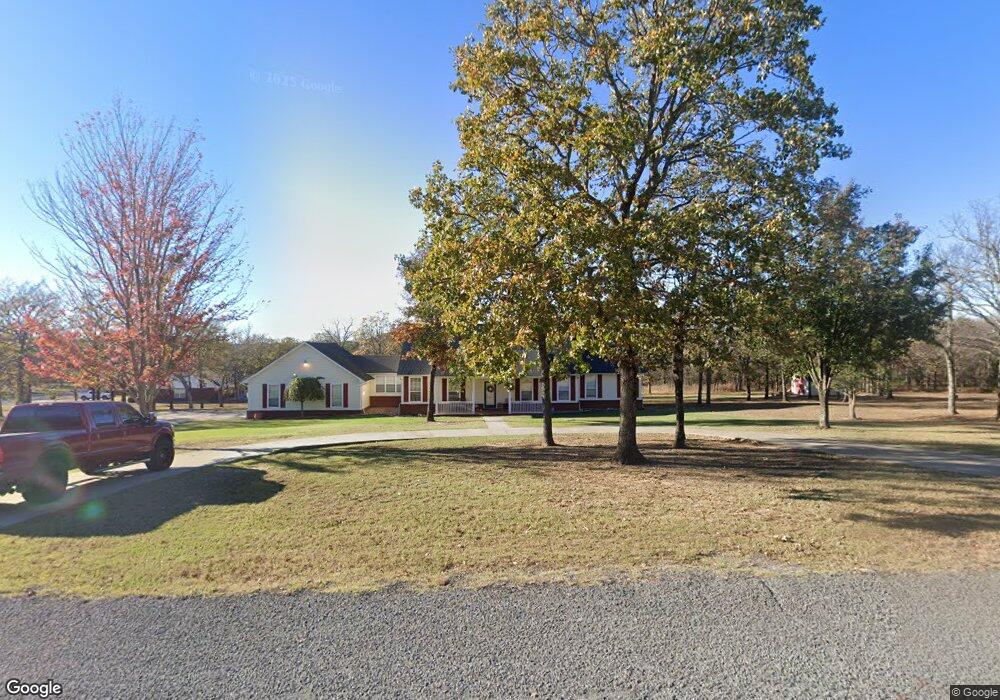
37 Jamestown Cir McAlester, OK 74501
Estimated Value: $346,865 - $377,000
3
Beds
2
Baths
2,401
Sq Ft
$152/Sq Ft
Est. Value
About This Home
This home is located at 37 Jamestown Cir, McAlester, OK 74501 and is currently estimated at $364,466, approximately $151 per square foot. 37 Jamestown Cir is a home located in Pittsburg County with nearby schools including Krebs Public School and Mcalester Christian Academy.
Ownership History
Date
Name
Owned For
Owner Type
Purchase Details
Closed on
Jan 30, 2020
Sold by
Sossaman Jack Michael and Sossaman Linda D
Bought by
Pittsburg County Properties Llc
Current Estimated Value
Purchase Details
Closed on
Apr 20, 2017
Sold by
Neal Julene and Neal Julene
Bought by
Sossamon Jack Michael and Sossamon Linda D
Purchase Details
Closed on
Apr 30, 2009
Sold by
Dunn Robert Scott and Dunn Frances Kaye
Bought by
Neal Randy and Neal Julene
Home Financials for this Owner
Home Financials are based on the most recent Mortgage that was taken out on this home.
Original Mortgage
$232,707
Interest Rate
5.03%
Mortgage Type
FHA
Purchase Details
Closed on
Jan 10, 2002
Sold by
Cendant Mobility Corp
Bought by
Scott Robert
Purchase Details
Closed on
Aug 3, 1999
Sold by
Barnett Jasonage
Bought by
Simmons Nicholas
Purchase Details
Closed on
Dec 21, 1998
Sold by
Peaceable Village
Bought by
Barnett
Create a Home Valuation Report for This Property
The Home Valuation Report is an in-depth analysis detailing your home's value as well as a comparison with similar homes in the area
Home Values in the Area
Average Home Value in this Area
Purchase History
| Date | Buyer | Sale Price | Title Company |
|---|---|---|---|
| Pittsburg County Properties Llc | -- | None Available | |
| Sossamon Jack Michael | $239,000 | None Available | |
| Neal Randy | $237,000 | None Available | |
| Scott Robert | $185,500 | -- | |
| Simmons Nicholas | $178,000 | -- | |
| Barnett | $18,000 | -- |
Source: Public Records
Mortgage History
| Date | Status | Borrower | Loan Amount |
|---|---|---|---|
| Previous Owner | Neal Randy | $232,707 |
Source: Public Records
Tax History Compared to Growth
Tax History
| Year | Tax Paid | Tax Assessment Tax Assessment Total Assessment is a certain percentage of the fair market value that is determined by local assessors to be the total taxable value of land and additions on the property. | Land | Improvement |
|---|---|---|---|---|
| 2025 | $2,439 | $27,525 | $3,740 | $23,785 |
| 2024 | $2,439 | $26,214 | $3,740 | $22,474 |
| 2023 | $2,224 | $24,966 | $3,740 | $21,226 |
| 2022 | $2,159 | $24,966 | $3,740 | $21,226 |
| 2021 | $2,162 | $24,966 | $3,740 | $21,226 |
| 2020 | $2,147 | $24,966 | $3,740 | $21,226 |
| 2019 | $2,101 | $24,352 | $3,740 | $20,612 |
| 2018 | $2,185 | $25,366 | $3,740 | $21,626 |
| 2017 | $2,221 | $25,366 | $3,740 | $21,626 |
| 2016 | $2,238 | $25,366 | $3,740 | $21,626 |
| 2015 | $1,944 | $26,070 | $1,145 | $24,925 |
| 2014 | $1,944 | $26,070 | $1,145 | $24,925 |
Source: Public Records
Map
Nearby Homes
- 0 Liberty Cir Unit 2546556
- 16 Kinkead Rd
- 813 Kinkead Rd
- 910 Summit Ridge
- 260 W Buttermilk Rd
- 0 Karen Place
- 108 Stubbs Ln
- 5 Karen Ct
- 1406 Country Club Rd
- 525 SW 3rd St
- 0 Torrey Pines Ct
- 4210 N Highway 69
- 345 SW 4th St
- 1424 Timber Ln
- 0 17th St Unit 2549375
- 0 17th St Unit 2549259
- 1842 Wood Rd
- 1314 Vieux Dr
- 2007 S 14th St
- 1 Golf View Cir
- 27 Jamestown Cir
- 34 Jamestown Cir
- 36 Jamestown Cir
- 29 Jamestown Cir
- 38 Jamestown Cir
- 24 Jamestown Cir
- 33 Jamestown Cir
- 25 Jamestown Cir
- 800 Village Blvd
- 14 Jamestown Cir
- 23 Jamestown Cir
- 803 Village Blvd
- 15 Jamestown Cir
- 103 Liberty Cir
- 40 Georgetown Cir
- 101 Liberty Cir
- 10 Georgetown Cir
- 708 Village Blvd
- 145 Liberty Cir