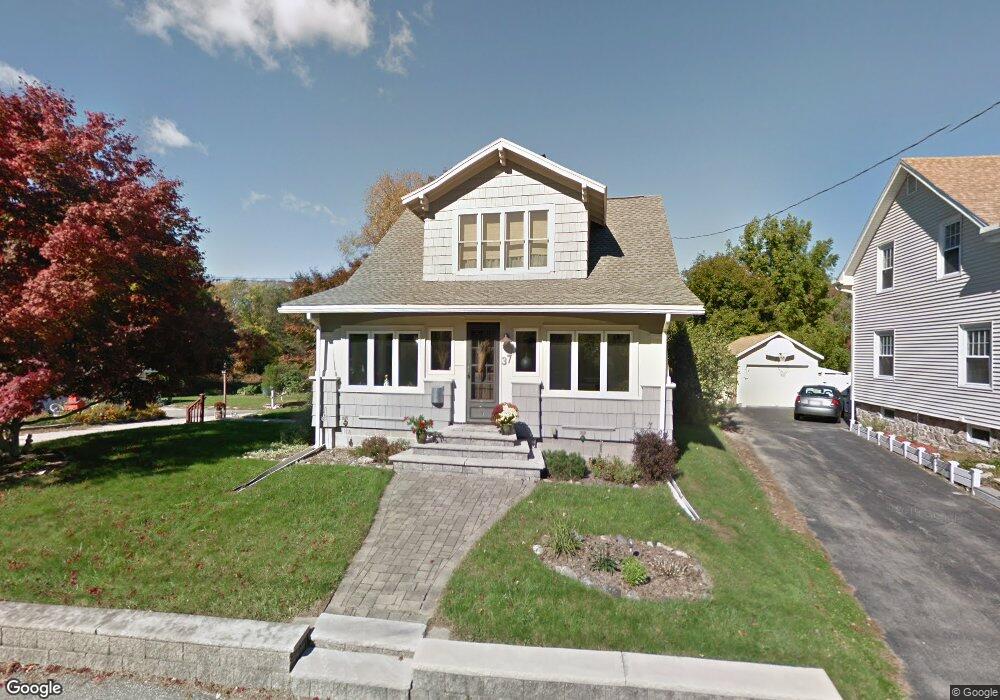
37 Klebart Ave Webster, MA 01570
Estimated Value: $354,797 - $405,000
3
Beds
1
Bath
1,365
Sq Ft
$280/Sq Ft
Est. Value
About This Home
This home is located at 37 Klebart Ave, Webster, MA 01570 and is currently estimated at $382,449, approximately $280 per square foot. 37 Klebart Ave is a home located in Worcester County with nearby schools including Park Avenue Elementary School, Webster Middle School, and Bartlett High School.
Ownership History
Date
Name
Owned For
Owner Type
Purchase Details
Closed on
Feb 17, 2010
Sold by
Wisniewski Erma H
Bought by
Erma H Wisniewski Irt
Current Estimated Value
Purchase Details
Closed on
Jun 14, 1991
Sold by
Penniman Penniman Mark C Mark C and Penniman Rhonda
Bought by
Wisniewski Erma H
Home Financials for this Owner
Home Financials are based on the most recent Mortgage that was taken out on this home.
Original Mortgage
$83,000
Interest Rate
9.39%
Mortgage Type
Purchase Money Mortgage
Purchase Details
Closed on
May 4, 1987
Sold by
Goulet Extr James F
Bought by
Penniman Mark C
Home Financials for this Owner
Home Financials are based on the most recent Mortgage that was taken out on this home.
Original Mortgage
$73,800
Interest Rate
8.99%
Mortgage Type
Purchase Money Mortgage
Create a Home Valuation Report for This Property
The Home Valuation Report is an in-depth analysis detailing your home's value as well as a comparison with similar homes in the area
Home Values in the Area
Average Home Value in this Area
Purchase History
| Date | Buyer | Sale Price | Title Company |
|---|---|---|---|
| Erma H Wisniewski Irt | -- | -- | |
| Wisniewski Erma H | $110,000 | -- | |
| Penniman Mark C | $82,000 | -- |
Source: Public Records
Mortgage History
| Date | Status | Borrower | Loan Amount |
|---|---|---|---|
| Previous Owner | Penniman Mark C | $80,000 | |
| Previous Owner | Penniman Mark C | $83,000 | |
| Previous Owner | Penniman Mark C | $73,800 |
Source: Public Records
Tax History
| Year | Tax Paid | Tax Assessment Tax Assessment Total Assessment is a certain percentage of the fair market value that is determined by local assessors to be the total taxable value of land and additions on the property. | Land | Improvement |
|---|---|---|---|---|
| 2025 | $3,331 | $280,400 | $55,600 | $224,800 |
| 2024 | $3,135 | $257,400 | $53,500 | $203,900 |
| 2023 | $2,780 | $222,400 | $46,300 | $176,100 |
| 2022 | $2,584 | $185,100 | $45,000 | $140,100 |
| 2021 | $2,594 | $171,800 | $45,000 | $126,800 |
| 2020 | $2,501 | $166,100 | $45,000 | $121,100 |
| 2019 | $2,345 | $153,000 | $45,000 | $108,000 |
| 2018 | $2,172 | $141,100 | $45,000 | $96,100 |
| 2017 | $2,080 | $137,500 | $44,000 | $93,500 |
| 2016 | $2,082 | $137,500 | $44,000 | $93,500 |
| 2015 | $1,979 | $134,800 | $43,200 | $91,600 |
Source: Public Records
Map
Nearby Homes
Your Personal Tour Guide
Ask me questions while you tour the home.