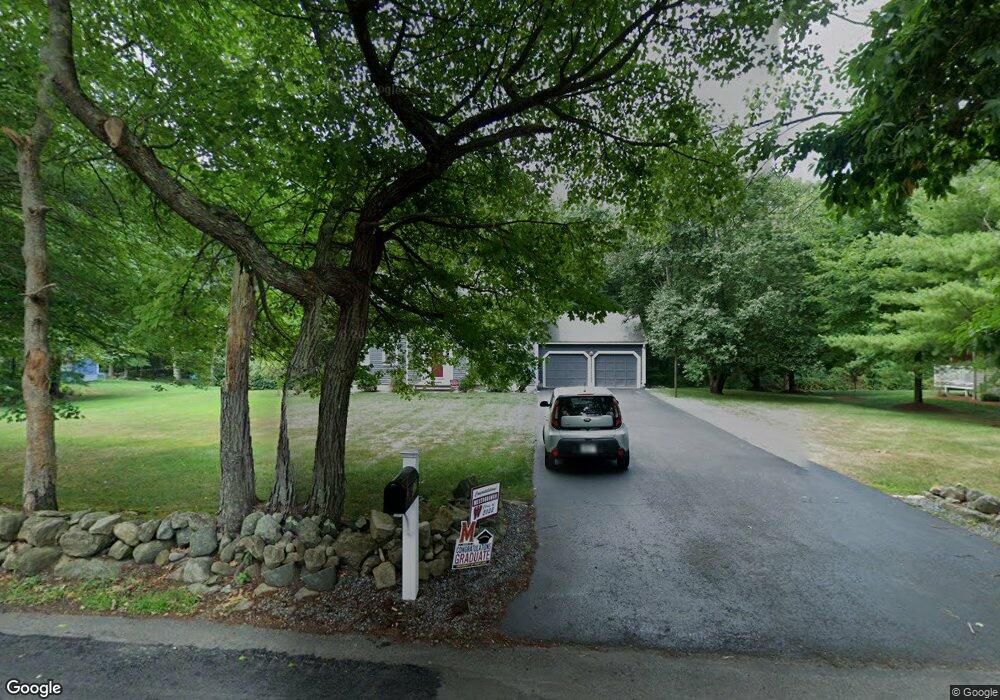
37 Lackey St Westborough, MA 01581
Estimated Value: $933,671 - $1,164,000
4
Beds
3
Baths
2,282
Sq Ft
$443/Sq Ft
Est. Value
About This Home
This home is located at 37 Lackey St, Westborough, MA 01581 and is currently estimated at $1,010,168, approximately $442 per square foot. 37 Lackey St is a home located in Worcester County with nearby schools including Westborough High School.
Ownership History
Date
Name
Owned For
Owner Type
Purchase Details
Closed on
Mar 16, 1998
Sold by
Diefenbacher Robert A and Bisson Pamela A
Bought by
Volin David J and Volin Laura E
Current Estimated Value
Purchase Details
Closed on
Sep 15, 1993
Sold by
Benton Richard D and Benton Marcia
Bought by
Diefenbacher Robert and Bisson Pamela
Purchase Details
Closed on
Aug 4, 1988
Sold by
Remley Jeanne B
Bought by
Benton Richard D
Create a Home Valuation Report for This Property
The Home Valuation Report is an in-depth analysis detailing your home's value as well as a comparison with similar homes in the area
Home Values in the Area
Average Home Value in this Area
Purchase History
| Date | Buyer | Sale Price | Title Company |
|---|---|---|---|
| Volin David J | $275,000 | -- | |
| Diefenbacher Robert | $260,000 | -- | |
| Benton Richard D | $285,000 | -- |
Source: Public Records
Mortgage History
| Date | Status | Borrower | Loan Amount |
|---|---|---|---|
| Open | Benton Richard D | $198,000 | |
| Closed | Benton Richard D | $200,000 |
Source: Public Records
Tax History Compared to Growth
Tax History
| Year | Tax Paid | Tax Assessment Tax Assessment Total Assessment is a certain percentage of the fair market value that is determined by local assessors to be the total taxable value of land and additions on the property. | Land | Improvement |
|---|---|---|---|---|
| 2025 | $13,322 | $817,800 | $338,500 | $479,300 |
| 2024 | $12,729 | $775,700 | $322,300 | $453,400 |
| 2023 | $12,014 | $713,400 | $303,800 | $409,600 |
| 2022 | $11,270 | $609,500 | $248,800 | $360,700 |
| 2021 | $5,058 | $585,000 | $224,300 | $360,700 |
| 2020 | $2,439 | $572,300 | $220,200 | $352,100 |
| 2019 | $9,909 | $540,600 | $218,200 | $322,400 |
| 2018 | $2,219 | $496,500 | $210,000 | $286,500 |
| 2017 | $8,838 | $496,500 | $210,000 | $286,500 |
| 2016 | $8,762 | $493,100 | $203,900 | $289,200 |
Source: Public Records
Map
Nearby Homes