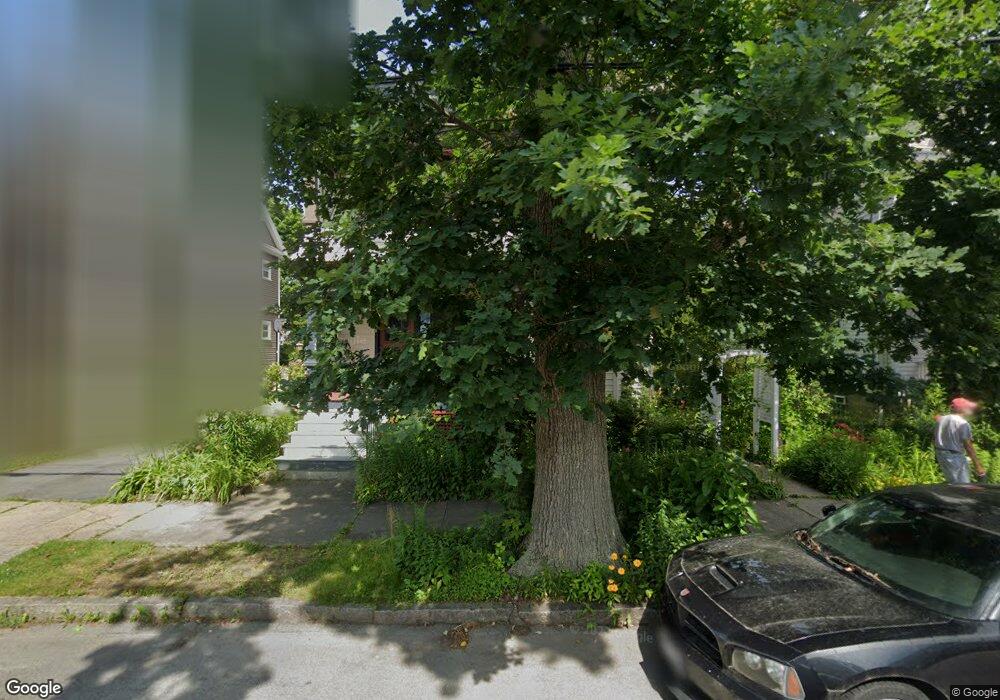
37 Laurel St Fairhaven, MA 02719
Estimated Value: $518,000 - $740,000
4
Beds
2
Baths
2,564
Sq Ft
$231/Sq Ft
Est. Value
About This Home
This home is located at 37 Laurel St, Fairhaven, MA 02719 and is currently estimated at $591,468, approximately $230 per square foot. 37 Laurel St is a home located in Bristol County with nearby schools including Fairhaven High School, City On A Hill Charter Public School New Bedford, and St. Joseph School.
Ownership History
Date
Name
Owned For
Owner Type
Purchase Details
Closed on
Aug 31, 2006
Sold by
Rogers Dorothy F and Rogers Ronald J
Bought by
Cruz Christine Jorda and Cruz Gordon R
Current Estimated Value
Home Financials for this Owner
Home Financials are based on the most recent Mortgage that was taken out on this home.
Original Mortgage
$260,000
Interest Rate
6.83%
Mortgage Type
Purchase Money Mortgage
Create a Home Valuation Report for This Property
The Home Valuation Report is an in-depth analysis detailing your home's value as well as a comparison with similar homes in the area
Home Values in the Area
Average Home Value in this Area
Purchase History
| Date | Buyer | Sale Price | Title Company |
|---|---|---|---|
| Cruz Christine Jorda | $325,000 | -- |
Source: Public Records
Mortgage History
| Date | Status | Borrower | Loan Amount |
|---|---|---|---|
| Open | Cruz Christine Jorda | $241,000 | |
| Closed | Cruz Christine Jorda | $10,000 | |
| Closed | Cruz Christine Jorda | $260,000 |
Source: Public Records
Tax History
| Year | Tax Paid | Tax Assessment Tax Assessment Total Assessment is a certain percentage of the fair market value that is determined by local assessors to be the total taxable value of land and additions on the property. | Land | Improvement |
|---|---|---|---|---|
| 2025 | $43 | $465,300 | $242,200 | $223,100 |
| 2024 | $4,225 | $457,800 | $242,200 | $215,600 |
| 2023 | $4,074 | $409,400 | $208,900 | $200,500 |
| 2022 | $3,860 | $377,700 | $190,300 | $187,400 |
| 2021 | $3,767 | $333,700 | $173,000 | $160,700 |
| 2020 | $3,691 | $333,700 | $173,000 | $160,700 |
| 2019 | $3,667 | $314,200 | $148,300 | $165,900 |
| 2018 | $3,443 | $297,200 | $141,100 | $156,100 |
| 2017 | $3,359 | $279,000 | $135,700 | $143,300 |
| 2016 | $3,200 | $262,700 | $133,100 | $129,600 |
| 2015 | $3,154 | $259,600 | $133,100 | $126,500 |
Source: Public Records
Map
Nearby Homes
- 32 Green St
- 32 Cedar St
- 11 Lawton St
- 2 Washburn Ave
- 24 Middle St
- 58 Washington St
- 0 Nulands Neck Unit 73286360
- 8 Washington St
- 145 Pleasant St
- 78 Middle St
- 8 Manor Dr
- 39 Christian St
- 77 Adams St
- 67 Bridge St
- 181 Washington St
- 138 Main St Unit 13
- 58 Bayview Ave
- 48 Bellevue St
- 16 Ash St
- 27 Bayview Ave
Your Personal Tour Guide
Ask me questions while you tour the home.