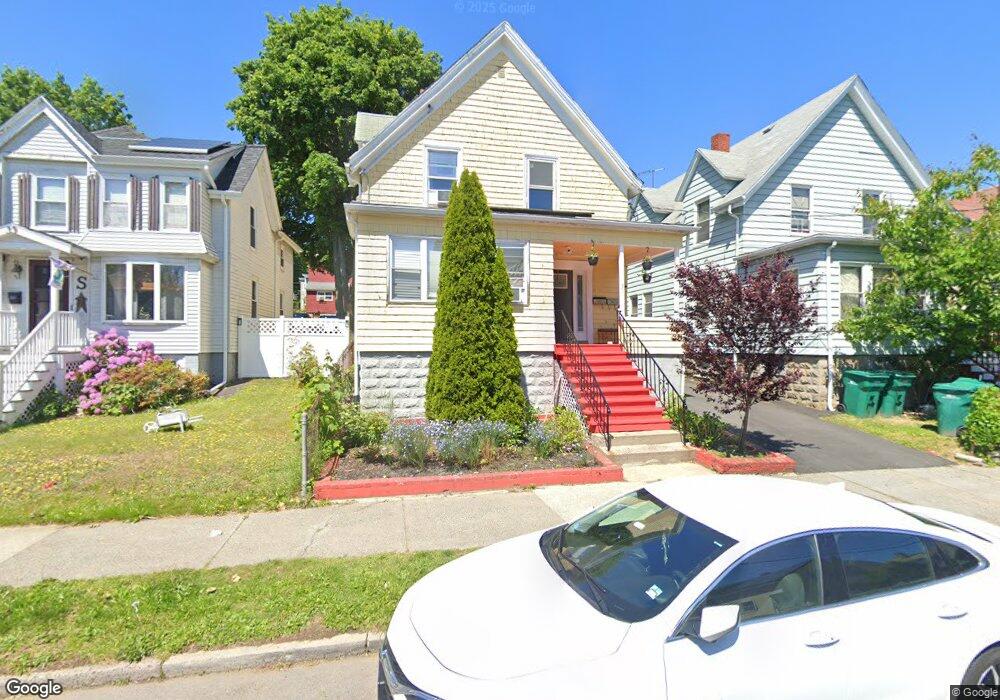
37 Laurel St Unit 2 Lynn, MA 01905
Lower Boston Street NeighborhoodEstimated Value: $602,000 - $770,000
2
Beds
1
Bath
1,600
Sq Ft
$415/Sq Ft
Est. Value
About This Home
This home is located at 37 Laurel St Unit 2, Lynn, MA 01905 and is currently estimated at $663,687, approximately $414 per square foot. 37 Laurel St Unit 2 is a home located in Essex County with nearby schools including William R. Fallon School, Drewicz Elementary School, and Breed Middle School.
Ownership History
Date
Name
Owned For
Owner Type
Purchase Details
Closed on
Sep 23, 2019
Sold by
Betancourt Matilde
Bought by
Chavez Pablo G
Current Estimated Value
Home Financials for this Owner
Home Financials are based on the most recent Mortgage that was taken out on this home.
Original Mortgage
$465,600
Outstanding Balance
$404,269
Interest Rate
3.5%
Mortgage Type
New Conventional
Estimated Equity
$259,418
Purchase Details
Closed on
Mar 8, 2007
Sold by
Wells Fargo Bk
Bought by
Chacon Matilde
Purchase Details
Closed on
Aug 13, 2004
Sold by
Hiscock George B and Hiscock Rosalie I
Bought by
Aviles Jose A and Aviles Patricia
Purchase Details
Closed on
Sep 30, 1987
Sold by
Gonzales Vincent P
Bought by
Hiscock George B
Create a Home Valuation Report for This Property
The Home Valuation Report is an in-depth analysis detailing your home's value as well as a comparison with similar homes in the area
Home Values in the Area
Average Home Value in this Area
Purchase History
| Date | Buyer | Sale Price | Title Company |
|---|---|---|---|
| Chavez Pablo G | $480,000 | -- | |
| Chavez Pablo G | $480,000 | -- | |
| Chavez Pablo G | $480,000 | -- | |
| Chacon Matilde | $230,000 | -- | |
| Chacon Matilde | $230,000 | -- | |
| Aviles Jose A | $310,000 | -- | |
| Aviles Jose A | $310,000 | -- | |
| Hiscock George B | $162,000 | -- |
Source: Public Records
Mortgage History
| Date | Status | Borrower | Loan Amount |
|---|---|---|---|
| Open | Chavez Pablo G | $465,600 | |
| Closed | Chavez Pablo G | $465,600 | |
| Previous Owner | Hiscock George B | $219,450 | |
| Previous Owner | Hiscock George B | $227,500 |
Source: Public Records
Tax History
| Year | Tax Paid | Tax Assessment Tax Assessment Total Assessment is a certain percentage of the fair market value that is determined by local assessors to be the total taxable value of land and additions on the property. | Land | Improvement |
|---|---|---|---|---|
| 2025 | $6,622 | $639,142 | $198,000 | $441,142 |
| 2024 | $6,255 | $594,000 | $184,100 | $409,900 |
| 2023 | $6,534 | $586,000 | $203,600 | $382,400 |
| 2022 | $6,374 | $512,800 | $155,900 | $356,900 |
| 2021 | $5,926 | $454,800 | $134,700 | $320,100 |
| 2020 | $5,674 | $423,400 | $138,200 | $285,200 |
| 2019 | $5,453 | $381,300 | $123,500 | $257,800 |
| 2018 | $5,022 | $331,500 | $111,300 | $220,200 |
| 2017 | $4,708 | $301,800 | $97,500 | $204,300 |
| 2016 | $4,399 | $271,900 | $89,700 | $182,200 |
| 2015 | $4,283 | $255,700 | $92,300 | $163,400 |
Source: Public Records
Map
Nearby Homes
- 79 Laurel St
- 28 Wyman St
- 73 Waterhill St
- 45 Cottage St Unit 3
- 20 Murray St
- 16 River St Unit 6
- 50-50A Kirtland St
- 21 Fenton Ave
- 10 River Street Place
- 37 Sargents Ct
- 93 Robinson St
- 268 Walnut St
- 32 Birch Brook Landing Unit 25
- 32 Birch Brook Landing Unit 22
- 32 Birch Brook Rd Unit 13
- 32 Birch Brook Rd Unit 27
- 32 Birch Brook Rd Unit 26
- 32 Birch Brook Rd Unit 16
- 32 Birch Brook Rd Unit 1
- 32 Birch Brook Rd Unit 15
Your Personal Tour Guide
Ask me questions while you tour the home.