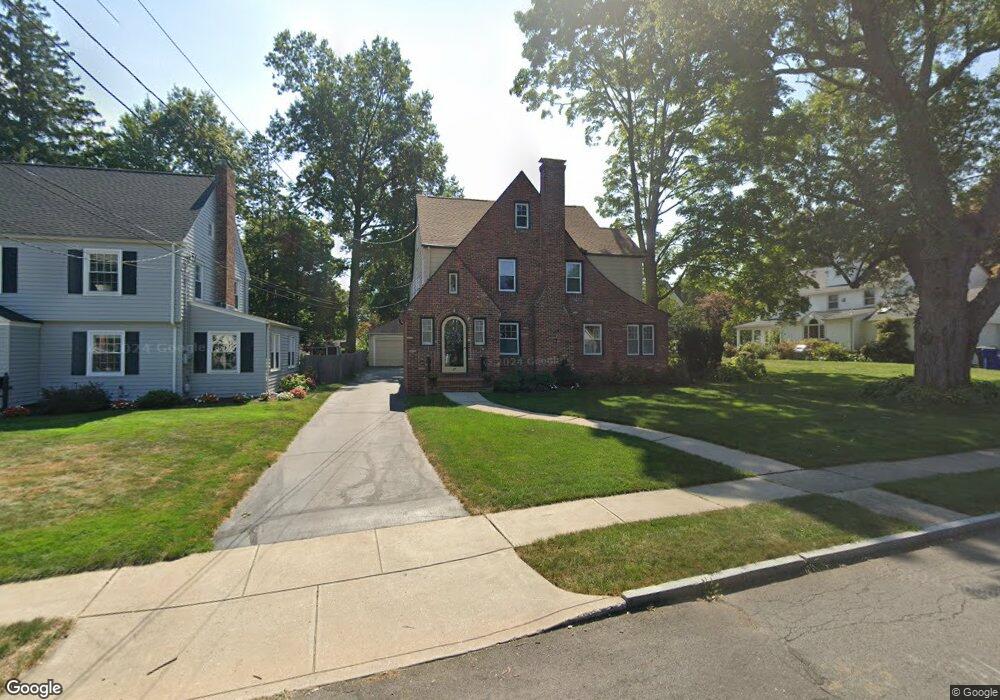
37 Linnard Rd West Hartford, CT 06107
Estimated Value: $765,000 - $881,000
4
Beds
3
Baths
2,404
Sq Ft
$334/Sq Ft
Est. Value
About This Home
This home is located at 37 Linnard Rd, West Hartford, CT 06107 and is currently estimated at $801,946, approximately $333 per square foot. 37 Linnard Rd is a home located in Hartford County with nearby schools including Bugbee School, King Philip Middle School, and Hall High School.
Ownership History
Date
Name
Owned For
Owner Type
Purchase Details
Closed on
Mar 29, 2024
Sold by
Defilippis Sarah C
Bought by
Sarah C Defilippis T C and Sarah Defilippis
Current Estimated Value
Purchase Details
Closed on
Jul 17, 1998
Sold by
Duguenoy Roger K and Duguenoy Diane
Bought by
Defillipis Sarah C and Defillipis Anthony
Home Financials for this Owner
Home Financials are based on the most recent Mortgage that was taken out on this home.
Original Mortgage
$212,000
Interest Rate
6.98%
Mortgage Type
Unknown
Purchase Details
Closed on
Jan 18, 1996
Sold by
Colliton Felice and Colliton Matthew
Bought by
Duquenoy Roger and Duquenoy Diane
Purchase Details
Closed on
Aug 16, 1989
Sold by
Roger-Klein
Bought by
Colliton Felice
Create a Home Valuation Report for This Property
The Home Valuation Report is an in-depth analysis detailing your home's value as well as a comparison with similar homes in the area
Home Values in the Area
Average Home Value in this Area
Purchase History
| Date | Buyer | Sale Price | Title Company |
|---|---|---|---|
| Sarah C Defilippis T C | -- | None Available | |
| Sarah C Defilippis T C | -- | None Available | |
| Defillipis Sarah C | $265,000 | -- | |
| Duquenoy Roger | $218,500 | -- | |
| Defillipis Sarah C | $265,000 | -- | |
| Duquenoy Roger | $218,500 | -- | |
| Colliton Felice | $255,000 | -- |
Source: Public Records
Mortgage History
| Date | Status | Borrower | Loan Amount |
|---|---|---|---|
| Previous Owner | Colliton Felice | $206,000 | |
| Previous Owner | Colliton Felice | $205,000 | |
| Previous Owner | Colliton Felice | $212,000 |
Source: Public Records
Tax History Compared to Growth
Tax History
| Year | Tax Paid | Tax Assessment Tax Assessment Total Assessment is a certain percentage of the fair market value that is determined by local assessors to be the total taxable value of land and additions on the property. | Land | Improvement |
|---|---|---|---|---|
| 2025 | $14,460 | $322,910 | $122,710 | $200,200 |
| 2024 | $13,675 | $322,910 | $122,710 | $200,200 |
| 2023 | $13,213 | $322,910 | $122,710 | $200,200 |
| 2022 | $12,424 | $305,410 | $122,710 | $182,700 |
| 2021 | $12,320 | $290,430 | $122,710 | $167,720 |
| 2020 | $12,193 | $291,690 | $124,740 | $166,950 |
| 2019 | $12,193 | $291,690 | $124,740 | $166,950 |
| 2018 | $11,959 | $291,690 | $124,740 | $166,950 |
| 2017 | $11,971 | $291,690 | $124,740 | $166,950 |
| 2016 | $10,465 | $264,880 | $107,310 | $157,570 |
| 2015 | $10,148 | $264,880 | $107,310 | $157,570 |
| 2014 | $9,899 | $264,880 | $107,310 | $157,570 |
Source: Public Records
Map
Nearby Homes
- 132 N Main St
- 1196 Trout Brook Dr
- 1110 Trout Brook Dr
- 183 Loomis Dr Unit 109
- 1272 Trout Brook Dr
- 105 Ardmore Rd
- 54 Robin Rd Unit B2
- 1006A Trout Brook Dr Unit 1006A
- 59 Milton St
- 869 Farmington Ave Unit 305
- 16 Lilley Rd
- 48 Walkley Rd
- 85 Memorial Rd Unit 512
- 2 Arapahoe Rd Unit 313
- 2 Arapahoe Rd Unit 308
- 2 Arapahoe Rd Unit 611
- 2 Arapahoe Rd Unit 601
- 2 Arapahoe Rd Unit 510
- 2 Arapahoe Rd Unit 505
- 2 Arapahoe Rd Unit 604
- 33 Linnard Rd
- 42 Montclair Dr
- 41 Middlefield Dr
- 45 Middlefield Dr
- 40 Montclair Dr
- 39 Middlefield Dr
- 38 Montclair Dr
- 38 Linnard Rd
- 36 Linnard Rd
- 50 Montclair Dr
- 37 Middlefield Dr
- 36 Montclair Dr
- 46 Middlefield Dr
- 32 Linnard Rd
- 43 Montclair Dr
- 35 Middlefield Dr
- 34 Montclair Dr
- 39 Montclair Dr
- 49 Montclair Dr
- 42 Middlefield Dr