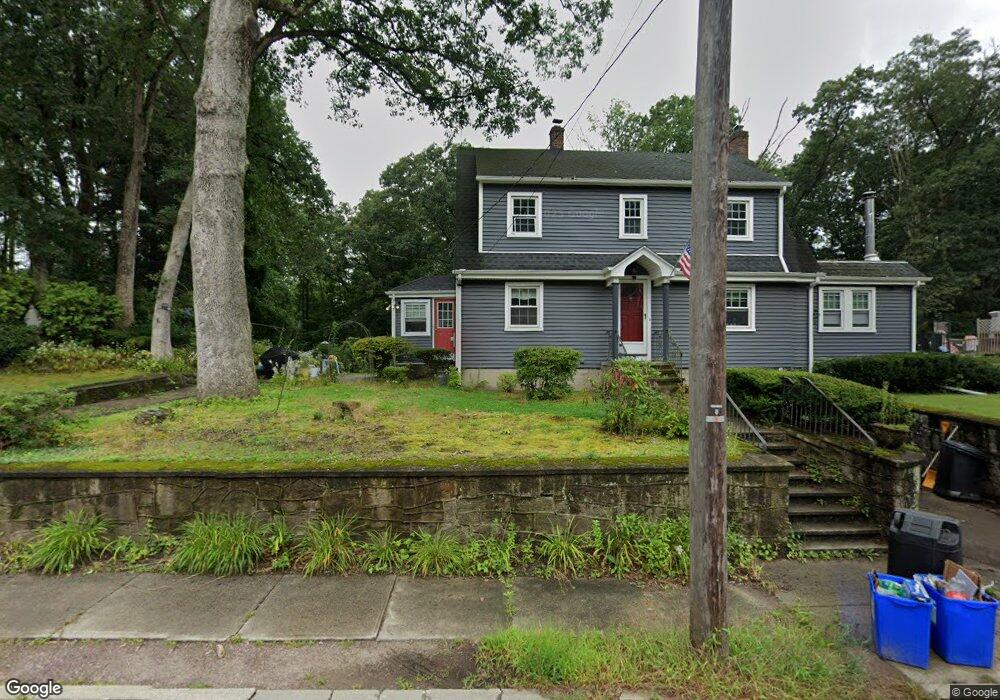
37 Maple Ave Forestdale, RI 02824
Estimated Value: $592,747 - $691,000
4
Beds
4
Baths
2,320
Sq Ft
$269/Sq Ft
Est. Value
About This Home
This home is located at 37 Maple Ave, Forestdale, RI 02824 and is currently estimated at $624,187, approximately $269 per square foot. 37 Maple Ave is a home located in Providence County with nearby schools including North Smithfield Elementary School, North Smithfield Middle School, and North Smithfield High School.
Ownership History
Date
Name
Owned For
Owner Type
Purchase Details
Closed on
Oct 22, 2025
Sold by
North Smithfield Town Of
Bought by
Amy Realty Rigp
Current Estimated Value
Purchase Details
Closed on
Jun 28, 2019
Sold by
Roberta J Bishop Ft 2015 and Bishop
Bought by
Roderick David M
Home Financials for this Owner
Home Financials are based on the most recent Mortgage that was taken out on this home.
Original Mortgage
$392,307
Interest Rate
4%
Mortgage Type
FHA
Purchase Details
Closed on
Jun 18, 2015
Sold by
Bishop Roberta J
Bought by
Roberta J Bishop T J and Roberta Bishop
Purchase Details
Closed on
Dec 31, 2009
Sold by
Janelle M Marquerite
Bought by
Janelle Roberta A
Purchase Details
Closed on
Oct 21, 1988
Sold by
Pilkington Philip E
Bought by
Heffernan Michael V
Home Financials for this Owner
Home Financials are based on the most recent Mortgage that was taken out on this home.
Original Mortgage
$84,800
Interest Rate
10.48%
Mortgage Type
Purchase Money Mortgage
Create a Home Valuation Report for This Property
The Home Valuation Report is an in-depth analysis detailing your home's value as well as a comparison with similar homes in the area
Home Values in the Area
Average Home Value in this Area
Purchase History
| Date | Buyer | Sale Price | Title Company |
|---|---|---|---|
| Amy Realty Rigp | $2,830 | -- | |
| Roderick David M | $378,500 | -- | |
| Roderick David M | $378,500 | -- | |
| Roberta J Bishop T J | $1,000 | -- | |
| Roberta J Bishop T J | $1,000 | -- | |
| Janelle Roberta A | -- | -- | |
| Janelle Roberta A | -- | -- | |
| Heffernan Michael V | $94,500 | -- | |
| Heffernan Michael V | $94,500 | -- |
Source: Public Records
Mortgage History
| Date | Status | Borrower | Loan Amount |
|---|---|---|---|
| Previous Owner | Roderick David M | $392,307 | |
| Previous Owner | Heffernan Michael V | $174,500 | |
| Previous Owner | Heffernan Michael V | $84,800 |
Source: Public Records
Tax History Compared to Growth
Tax History
| Year | Tax Paid | Tax Assessment Tax Assessment Total Assessment is a certain percentage of the fair market value that is determined by local assessors to be the total taxable value of land and additions on the property. | Land | Improvement |
|---|---|---|---|---|
| 2024 | $6,186 | $418,800 | $105,200 | $313,600 |
| 2023 | $5,968 | $418,800 | $105,200 | $313,600 |
| 2022 | $5,826 | $418,800 | $105,200 | $313,600 |
| 2021 | $5,838 | $358,400 | $85,300 | $273,100 |
| 2020 | $5,838 | $358,400 | $85,300 | $273,100 |
| 2019 | $5,688 | $358,400 | $85,300 | $273,100 |
| 2018 | $4,986 | $289,200 | $88,700 | $200,500 |
| 2017 | $4,864 | $289,200 | $88,700 | $200,500 |
| 2016 | $4,731 | $289,200 | $88,700 | $200,500 |
| 2015 | $4,502 | $269,900 | $85,400 | $184,500 |
| 2014 | -- | $269,900 | $85,400 | $184,500 |
Source: Public Records
Map
Nearby Homes
- 53 Maple Ave
- 104 Old Great Rd
- 170 Providence Pike Unit 64
- 170 Providence Pike Unit 47
- 5 Branch Ave
- 612 Great Rd
- 470 Saint Paul St
- 5 Lincoln Dr
- 5 Laurel Ln
- 815 Pound Hill Rd
- 784 Victory Hwy
- 4 Sharon Pkwy
- 14 Lapre Rd
- 0 Brentwood Dr
- 246 Saint Paul St
- 1 Tupperware Dr Unit 226
- 1 Tupperware Dr Unit 138
- 1 Tupperware Dr Unit 108
- 0 Buxton St Unit 1386233
- 12 Silver Pines Blvd Unit 12
- 0 Maple Ave Unit 1227161
- 0 Maple Ave Unit 1227159
- 0 Maple Ave Unit 1229443
- 0 Maple Ave Unit 1313273
- 0 Maple Ave Unit 1207663
- 33 Maple Ave
- 32 Maple Ave
- 38 Maple Ave
- 30 Maple Ave
- 31 Maple Ave
- 42 Maple Ave
- 42 Maple Ave
- 43 Maple Ave
- 43 Maple Ave
- 26 Maple Ave
- 9 Wildwood Rd
- 7 Wildwood Rd
- 29 Maple Ave
- 44 Maple Ave
- 46 Maple Ave