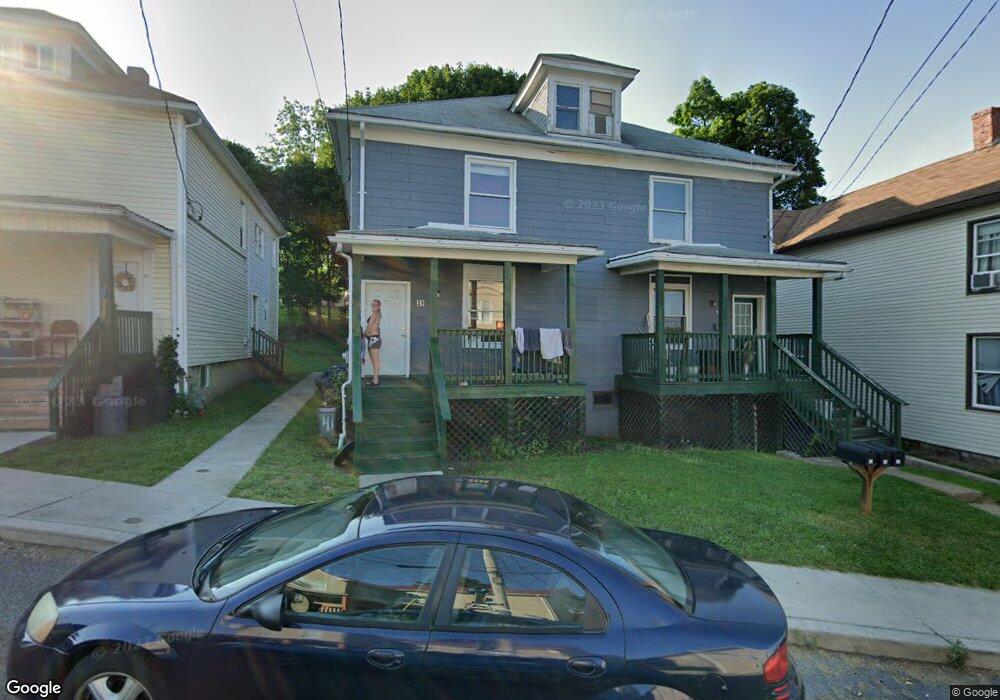
37 Maple St Frostburg, MD 21532
Estimated Value: $145,000 - $173,000
--
Bed
2
Baths
3,280
Sq Ft
$48/Sq Ft
Est. Value
About This Home
This home is located at 37 Maple St, Frostburg, MD 21532 and is currently estimated at $158,758, approximately $48 per square foot. 37 Maple St is a home located in Allegany County with nearby schools including Beall Elementary School, Mount Savage Middle School, and Mountain Ridge High School.
Ownership History
Date
Name
Owned For
Owner Type
Purchase Details
Closed on
Nov 14, 2003
Sold by
Legacy Management Group Llc
Bought by
Legacy Management Group Llc
Current Estimated Value
Purchase Details
Closed on
Oct 3, 2003
Sold by
Legacy Management Group Llc
Bought by
Legacy Management Group Llc
Purchase Details
Closed on
Aug 7, 2002
Sold by
U S A Partnership
Bought by
Legacy Management Group Llc
Purchase Details
Closed on
Jan 4, 1996
Sold by
Senka James
Bought by
Senka James and Senka Alice F
Create a Home Valuation Report for This Property
The Home Valuation Report is an in-depth analysis detailing your home's value as well as a comparison with similar homes in the area
Home Values in the Area
Average Home Value in this Area
Purchase History
| Date | Buyer | Sale Price | Title Company |
|---|---|---|---|
| Legacy Management Group Llc | -- | -- | |
| Legacy Management Group Llc | -- | -- | |
| Legacy Management Group Llc | $112,500 | -- | |
| Senka James | -- | -- |
Source: Public Records
Mortgage History
| Date | Status | Borrower | Loan Amount |
|---|---|---|---|
| Closed | Senka James | -- |
Source: Public Records
Tax History Compared to Growth
Tax History
| Year | Tax Paid | Tax Assessment Tax Assessment Total Assessment is a certain percentage of the fair market value that is determined by local assessors to be the total taxable value of land and additions on the property. | Land | Improvement |
|---|---|---|---|---|
| 2025 | $1,333 | $131,100 | $12,000 | $119,100 |
| 2024 | $1,261 | $122,167 | $0 | $0 |
| 2023 | $1,144 | $113,233 | $0 | $0 |
| 2022 | $1,055 | $104,300 | $12,000 | $92,300 |
| 2021 | $1,061 | $104,300 | $12,000 | $92,300 |
| 2020 | $1,024 | $104,300 | $12,000 | $92,300 |
| 2019 | $1,066 | $107,700 | $12,000 | $95,700 |
| 2018 | $1,081 | $107,700 | $12,000 | $95,700 |
| 2017 | $1,071 | $107,700 | $0 | $0 |
| 2016 | $1,061 | $109,000 | $0 | $0 |
| 2015 | $1,068 | $109,000 | $0 | $0 |
| 2014 | $1,068 | $109,000 | $0 | $0 |
Source: Public Records
Map
Nearby Homes