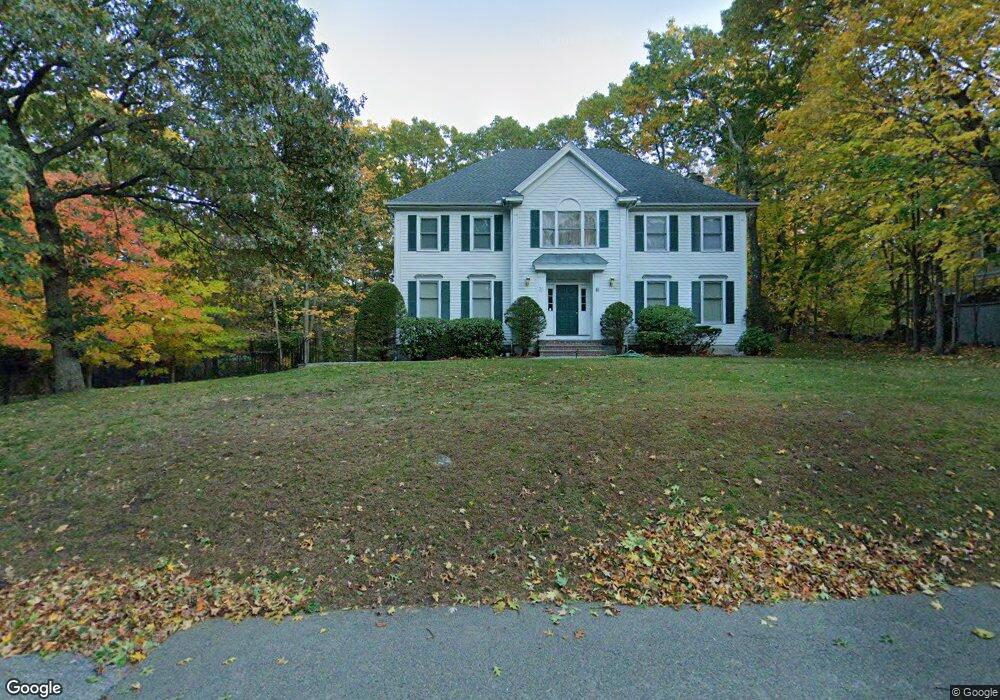
37 Maple St Lexington, MA 02420
Pheasant Brook Estates NeighborhoodEstimated Value: $1,531,000 - $2,212,000
4
Beds
5
Baths
3,859
Sq Ft
$479/Sq Ft
Est. Value
About This Home
This home is located at 37 Maple St, Lexington, MA 02420 and is currently estimated at $1,850,345, approximately $479 per square foot. 37 Maple St is a home located in Middlesex County with nearby schools including Harrington Elementary School, Jonas Clarke Middle School, and Lexington High School.
Ownership History
Date
Name
Owned For
Owner Type
Purchase Details
Closed on
Jul 8, 1999
Sold by
Bruce Linda
Bought by
Strong William S and Strong Ann R
Current Estimated Value
Purchase Details
Closed on
Jan 29, 1992
Sold by
Morel Francois M and Morel Nicole M
Bought by
Marsh William S and Bruce-Marsh Linda
Create a Home Valuation Report for This Property
The Home Valuation Report is an in-depth analysis detailing your home's value as well as a comparison with similar homes in the area
Home Values in the Area
Average Home Value in this Area
Purchase History
| Date | Buyer | Sale Price | Title Company |
|---|---|---|---|
| Strong William S | $711,000 | -- | |
| Marsh William S | $522,500 | -- |
Source: Public Records
Mortgage History
| Date | Status | Borrower | Loan Amount |
|---|---|---|---|
| Open | Marsh William S | $194,000 | |
| Closed | Marsh William S | $209,000 |
Source: Public Records
Tax History
| Year | Tax Paid | Tax Assessment Tax Assessment Total Assessment is a certain percentage of the fair market value that is determined by local assessors to be the total taxable value of land and additions on the property. | Land | Improvement |
|---|---|---|---|---|
| 2025 | $23,824 | $1,948,000 | $711,000 | $1,237,000 |
| 2024 | $22,785 | $1,860,000 | $677,000 | $1,183,000 |
| 2023 | $22,633 | $1,741,000 | $618,000 | $1,123,000 |
| 2022 | $21,763 | $1,577,000 | $564,000 | $1,013,000 |
| 2021 | $21,340 | $1,483,000 | $539,000 | $944,000 |
| 2020 | $21,356 | $1,520,000 | $539,000 | $981,000 |
| 2019 | $20,418 | $1,446,000 | $514,000 | $932,000 |
| 2018 | $20,120 | $1,407,000 | $491,000 | $916,000 |
| 2017 | $20,648 | $1,425,000 | $468,000 | $957,000 |
| 2016 | $20,367 | $1,395,000 | $441,000 | $954,000 |
| 2015 | $17,074 | $1,149,000 | $401,000 | $748,000 |
| 2014 | $19,419 | $1,252,000 | $365,000 | $887,000 |
Source: Public Records
Map
Nearby Homes
- 25 Maple St
- 20 Maple St
- 16 Lily Pond Ln Unit 16
- 2 Beech Tree Ln
- 9 Pelham Rd
- 10 Eliot Rd
- 1 Tricorne Rd
- 197 Woburn St
- 218 Lowell St
- 12 Brandon St
- 28 Webb St
- 1437 Massachusetts Ave
- 7 Whipple Rd
- 51 Bloomfield St
- 1475 Massachusetts Ave Unit 467
- 34 Bow St
- 67 Lowell St
- 15 Slocum Rd
- 71 Webb St
- 8 Blueberry Ln
Your Personal Tour Guide
Ask me questions while you tour the home.