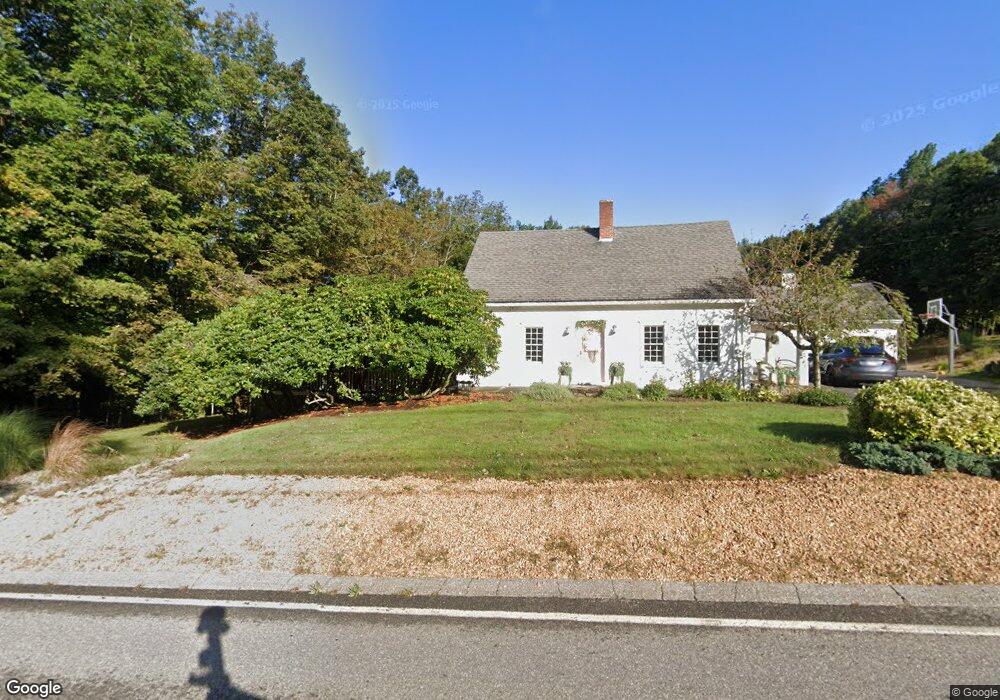
37 Maple St Paxton, MA 01612
Estimated Value: $655,514 - $721,000
4
Beds
4
Baths
2,300
Sq Ft
$297/Sq Ft
Est. Value
About This Home
This home is located at 37 Maple St, Paxton, MA 01612 and is currently estimated at $683,879, approximately $297 per square foot. 37 Maple St is a home located in Worcester County with nearby schools including Wachusett Regional High School and Holden Christian Academy.
Ownership History
Date
Name
Owned For
Owner Type
Purchase Details
Closed on
Sep 20, 2010
Sold by
Clauson John R and Clauson Laureen A
Bought by
Daly Michael J and Daly Courtney A
Current Estimated Value
Home Financials for this Owner
Home Financials are based on the most recent Mortgage that was taken out on this home.
Original Mortgage
$245,000
Outstanding Balance
$162,355
Interest Rate
4.51%
Mortgage Type
Purchase Money Mortgage
Estimated Equity
$521,524
Purchase Details
Closed on
Mar 24, 2000
Sold by
Daly William E
Bought by
Daly Michael J
Purchase Details
Closed on
Aug 12, 1994
Sold by
Robinson Paul S and Robinson Kathleen M
Bought by
Clauson John R and Clauson Laureen
Home Financials for this Owner
Home Financials are based on the most recent Mortgage that was taken out on this home.
Original Mortgage
$110,800
Interest Rate
8.52%
Mortgage Type
Purchase Money Mortgage
Create a Home Valuation Report for This Property
The Home Valuation Report is an in-depth analysis detailing your home's value as well as a comparison with similar homes in the area
Home Values in the Area
Average Home Value in this Area
Purchase History
| Date | Buyer | Sale Price | Title Company |
|---|---|---|---|
| Daly Michael J | $395,000 | -- | |
| Daly Michael J | $10,000 | -- | |
| Clauson John R | $138,500 | -- |
Source: Public Records
Mortgage History
| Date | Status | Borrower | Loan Amount |
|---|---|---|---|
| Open | Daly Michael J | $245,000 | |
| Previous Owner | Clauson John R | $274,000 | |
| Previous Owner | Clauson John R | $60,000 | |
| Previous Owner | Clauson John R | $110,800 |
Source: Public Records
Tax History Compared to Growth
Tax History
| Year | Tax Paid | Tax Assessment Tax Assessment Total Assessment is a certain percentage of the fair market value that is determined by local assessors to be the total taxable value of land and additions on the property. | Land | Improvement |
|---|---|---|---|---|
| 2025 | $8,791 | $596,400 | $119,300 | $477,100 |
| 2024 | $8,695 | $541,100 | $119,300 | $421,800 |
| 2023 | $8,792 | $500,100 | $109,100 | $391,000 |
| 2022 | $8,271 | $435,800 | $109,100 | $326,700 |
| 2021 | $8,340 | $422,700 | $100,100 | $322,600 |
| 2020 | $8,174 | $414,300 | $91,700 | $322,600 |
| 2019 | $8,074 | $409,000 | $83,900 | $325,100 |
| 2018 | $7,913 | $387,300 | $80,900 | $306,400 |
| 2017 | $7,801 | $382,600 | $76,900 | $305,700 |
| 2016 | $7,491 | $363,800 | $73,200 | $290,600 |
| 2015 | $6,881 | $331,000 | $73,200 | $257,800 |
| 2014 | $6,703 | $326,800 | $74,400 | $252,400 |
Source: Public Records
Map
Nearby Homes