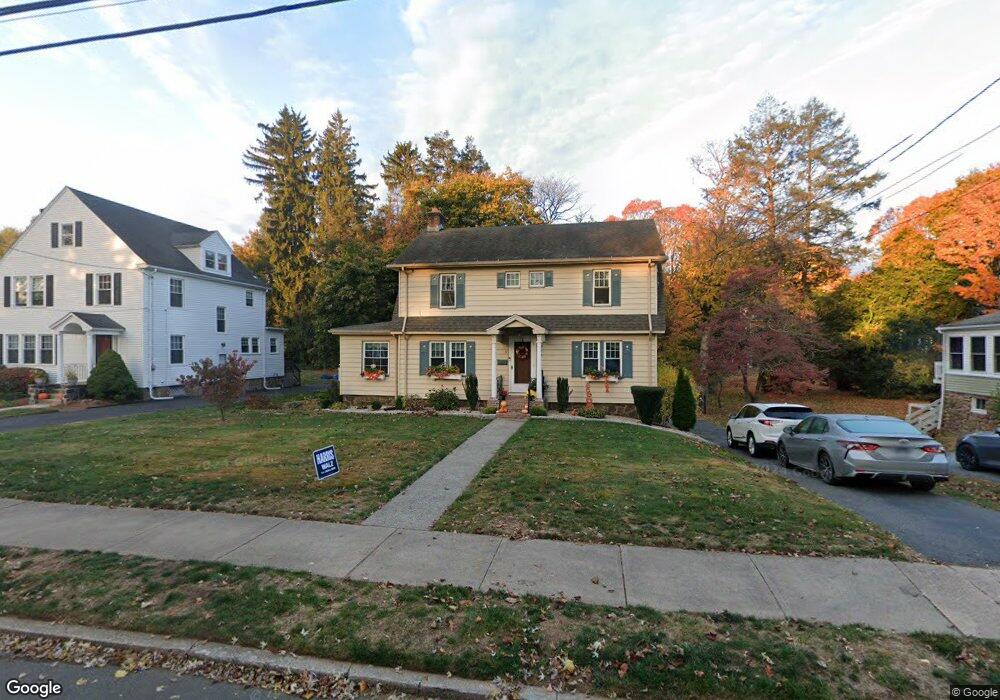
37 Mason Dr New Britain, CT 06052
Estimated Value: $332,000 - $406,000
3
Beds
2
Baths
1,964
Sq Ft
$183/Sq Ft
Est. Value
About This Home
This home is located at 37 Mason Dr, New Britain, CT 06052 and is currently estimated at $360,187, approximately $183 per square foot. 37 Mason Dr is a home located in Hartford County with nearby schools including Vance School, Slade Middle School, and Raymond Hill School.
Ownership History
Date
Name
Owned For
Owner Type
Purchase Details
Closed on
Jun 25, 2025
Sold by
Silvestro
Bought by
Silvestro Ft and Scalise
Current Estimated Value
Purchase Details
Closed on
Sep 5, 2023
Sold by
Silvestro Patrick and Silvestro Cheryl A
Bought by
Silvestro
Create a Home Valuation Report for This Property
The Home Valuation Report is an in-depth analysis detailing your home's value as well as a comparison with similar homes in the area
Home Values in the Area
Average Home Value in this Area
Purchase History
| Date | Buyer | Sale Price | Title Company |
|---|---|---|---|
| Silvestro Ft | -- | -- | |
| Silvestro | -- | None Available | |
| Silvestro | -- | None Available |
Source: Public Records
Tax History Compared to Growth
Tax History
| Year | Tax Paid | Tax Assessment Tax Assessment Total Assessment is a certain percentage of the fair market value that is determined by local assessors to be the total taxable value of land and additions on the property. | Land | Improvement |
|---|---|---|---|---|
| 2025 | $8,014 | $204,540 | $56,980 | $147,560 |
| 2024 | $8,098 | $204,540 | $56,980 | $147,560 |
| 2023 | $7,830 | $204,540 | $56,980 | $147,560 |
| 2022 | $6,694 | $135,240 | $26,250 | $108,990 |
| 2021 | $6,694 | $135,240 | $26,250 | $108,990 |
| 2020 | $6,830 | $135,240 | $26,250 | $108,990 |
| 2019 | $6,405 | $126,840 | $26,250 | $100,590 |
| 2018 | $6,405 | $126,840 | $26,250 | $100,590 |
| 2017 | $6,515 | $129,010 | $26,740 | $102,270 |
| 2016 | $6,515 | $129,010 | $26,740 | $102,270 |
| 2015 | $6,321 | $129,010 | $26,740 | $102,270 |
| 2014 | $6,321 | $129,010 | $26,740 | $102,270 |
Source: Public Records
Map
Nearby Homes