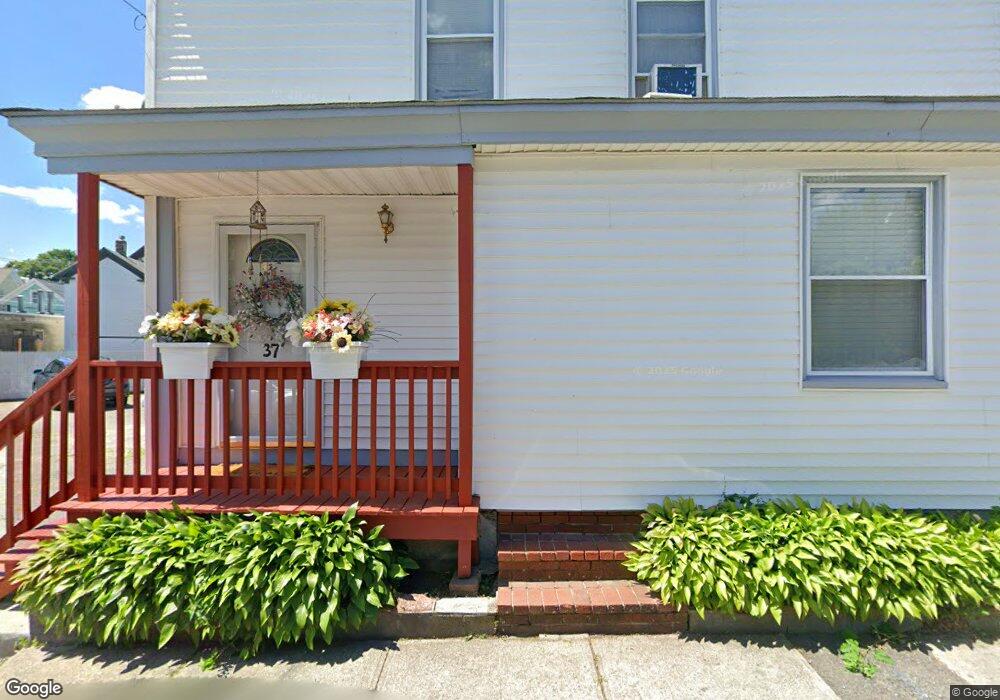
37 Merrill St Lowell, MA 01852
Back Central NeighborhoodEstimated Value: $441,000 - $567,000
6
Beds
4
Baths
1,552
Sq Ft
$326/Sq Ft
Est. Value
About This Home
This home is located at 37 Merrill St, Lowell, MA 01852 and is currently estimated at $506,657, approximately $326 per square foot. 37 Merrill St is a home located in Middlesex County with nearby schools including Moody Elementary School, Abraham Lincoln Elementary School, and Greenhalge Elementary School.
Ownership History
Date
Name
Owned For
Owner Type
Purchase Details
Closed on
Mar 1, 2005
Sold by
Rosa Millette and Carrucini Orlando
Bought by
Torres Luis
Current Estimated Value
Home Financials for this Owner
Home Financials are based on the most recent Mortgage that was taken out on this home.
Original Mortgage
$220,500
Outstanding Balance
$112,675
Interest Rate
5.73%
Mortgage Type
Purchase Money Mortgage
Estimated Equity
$393,982
Purchase Details
Closed on
Aug 13, 1997
Sold by
Labednick Ethel
Bought by
Carrucini Orlando and Rosa Millette
Home Financials for this Owner
Home Financials are based on the most recent Mortgage that was taken out on this home.
Original Mortgage
$71,250
Interest Rate
7.56%
Mortgage Type
Purchase Money Mortgage
Create a Home Valuation Report for This Property
The Home Valuation Report is an in-depth analysis detailing your home's value as well as a comparison with similar homes in the area
Home Values in the Area
Average Home Value in this Area
Purchase History
| Date | Buyer | Sale Price | Title Company |
|---|---|---|---|
| Torres Luis | $245,000 | -- | |
| Torres Luis | $245,000 | -- | |
| Carrucini Orlando | $75,000 | -- | |
| Carrucini Orlando | $75,000 | -- |
Source: Public Records
Mortgage History
| Date | Status | Borrower | Loan Amount |
|---|---|---|---|
| Open | Torres Luis | $220,500 | |
| Closed | Carrucini Orlando | $220,500 | |
| Previous Owner | Carrucini Orlando | $71,250 |
Source: Public Records
Tax History
| Year | Tax Paid | Tax Assessment Tax Assessment Total Assessment is a certain percentage of the fair market value that is determined by local assessors to be the total taxable value of land and additions on the property. | Land | Improvement |
|---|---|---|---|---|
| 2025 | $4,972 | $433,100 | $137,800 | $295,300 |
| 2024 | $4,800 | $403,000 | $124,300 | $278,700 |
| 2023 | $4,533 | $365,000 | $108,100 | $256,900 |
| 2022 | $4,093 | $322,500 | $85,300 | $237,200 |
| 2021 | $3,829 | $284,500 | $74,200 | $210,300 |
| 2020 | $3,499 | $261,900 | $61,800 | $200,100 |
| 2019 | $3,250 | $231,500 | $57,200 | $174,300 |
| 2018 | $3,182 | $221,100 | $54,500 | $166,600 |
| 2017 | $3,223 | $216,000 | $59,500 | $156,500 |
| 2016 | $3,085 | $203,500 | $59,800 | $143,700 |
| 2015 | $2,992 | $193,300 | $59,800 | $133,500 |
| 2013 | $2,541 | $169,300 | $69,000 | $100,300 |
Source: Public Records
Map
Nearby Homes
- 31 Merrill St
- 80 Rogers St Unit 204
- 5 Floyd St
- 254 Pleasant St
- 39 Groves Ave
- 88 Perry St
- 7 Butler Ave Unit 5
- 85 Kinsman St
- 8 Cedar Ct
- 810 Lawrence St Unit C
- 200 Rogers St Unit 6
- 95 S Highland St
- 44 Hanks St
- 234 Nesmith St Unit 8
- 313 Nesmith St
- 900 Lawrence St Unit 5
- 5 Lenox St Unit 2
- 5 Lenox St Unit 4
- 191 Thorndike St Unit 26
- 201 Thorndike St Unit 501
Your Personal Tour Guide
Ask me questions while you tour the home.