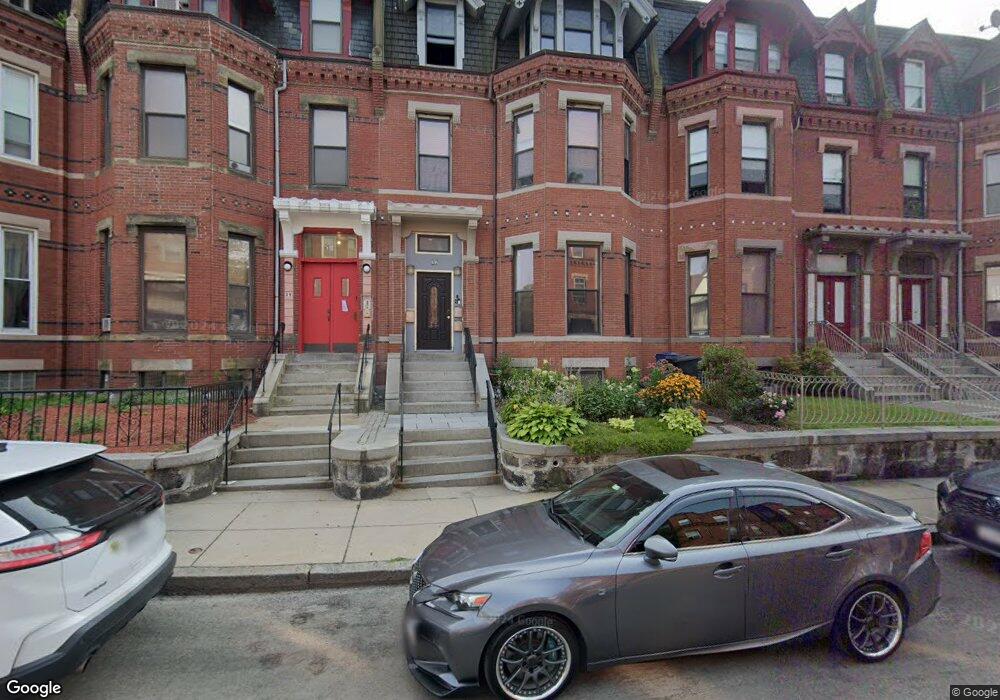
37 Moreland St Unit 2 Roxbury, MA 02119
Sav-Mor NeighborhoodEstimated Value: $424,000 - $614,000
2
Beds
1
Bath
1,194
Sq Ft
$405/Sq Ft
Est. Value
About This Home
This home is located at 37 Moreland St Unit 2, Roxbury, MA 02119 and is currently estimated at $483,603, approximately $405 per square foot. 37 Moreland St Unit 2 is a home located in Suffolk County with nearby schools including Dudley Street Neighborhood Charter School and City on a Hill Charter Public School.
Ownership History
Date
Name
Owned For
Owner Type
Purchase Details
Closed on
May 7, 2004
Sold by
Chowdhury Solomon
Bought by
Phillips Melissa
Current Estimated Value
Home Financials for this Owner
Home Financials are based on the most recent Mortgage that was taken out on this home.
Original Mortgage
$180,000
Outstanding Balance
$83,741
Interest Rate
5.39%
Mortgage Type
Purchase Money Mortgage
Estimated Equity
$399,862
Create a Home Valuation Report for This Property
The Home Valuation Report is an in-depth analysis detailing your home's value as well as a comparison with similar homes in the area
Home Values in the Area
Average Home Value in this Area
Purchase History
| Date | Buyer | Sale Price | Title Company |
|---|---|---|---|
| Phillips Melissa | $220,000 | -- |
Source: Public Records
Mortgage History
| Date | Status | Borrower | Loan Amount |
|---|---|---|---|
| Open | Phillips Melissa | $180,000 |
Source: Public Records
Tax History
| Year | Tax Paid | Tax Assessment Tax Assessment Total Assessment is a certain percentage of the fair market value that is determined by local assessors to be the total taxable value of land and additions on the property. | Land | Improvement |
|---|---|---|---|---|
| 2025 | $4,258 | $367,700 | $0 | $367,700 |
| 2024 | $4,084 | $374,700 | $0 | $374,700 |
| 2023 | $3,870 | $360,300 | $0 | $360,300 |
| 2022 | $3,733 | $343,100 | $0 | $343,100 |
| 2021 | $3,589 | $336,400 | $0 | $336,400 |
| 2020 | $2,997 | $283,800 | $0 | $283,800 |
| 2019 | $2,719 | $258,000 | $0 | $258,000 |
| 2018 | $2,457 | $234,400 | $0 | $234,400 |
| 2017 | $2,320 | $219,100 | $0 | $219,100 |
| 2016 | $2,253 | $204,800 | $0 | $204,800 |
| 2015 | $2,084 | $172,100 | $0 | $172,100 |
| 2014 | $2,042 | $162,300 | $0 | $162,300 |
Source: Public Records
Map
Nearby Homes
- 22-22A Montrose St
- 20 Rockville Park
- 22 Rockville Park
- 59 Copeland St
- 30 Copeland St Unit 1
- 33 Copeland St Unit CC
- 7 Langford Park Unit 3
- 59 Perrin St Unit 3
- 108 Mount Pleasant Ave Unit 4
- 102 Mount Pleasant Ave
- 64 Alpine St Unit 104
- 64 Alpine St Unit 304
- 10 Forest St
- 12 Forest St
- 80 Blue Hill Ave Unit 5
- 22 Alaska St
- 301-305 Dudley St
- 299 Dudley St
- 45 Woodville St
- 51 Saint James St
- 37 Moreland St Unit 3
- 37 Moreland St Unit 1
- 39 Moreland St
- 41 Moreland St
- 35 Moreland St
- 35 Moreland St
- 35 Moreland St Unit 2
- 43 Moreland St
- 43 Moreland St Unit 3
- 33 Moreland St
- 33 Moreland St Unit 3
- 33 Moreland St Unit 1
- 33 Moreland St
- 33 Moreland St Unit 2
- 38 Moreland St Unit 4
- 38 Moreland St Unit 3
- 38 Moreland St Unit 2
- 38 Moreland St Unit 1
- 36 Moreland St
- 36 Moreland St Unit 2
Your Personal Tour Guide
Ask me questions while you tour the home.