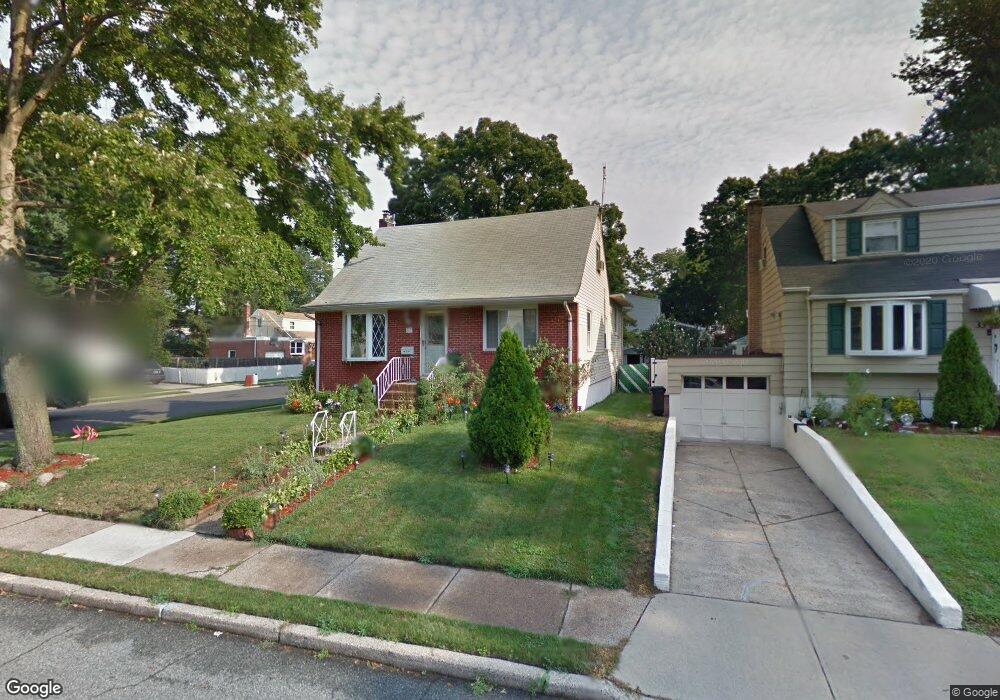
37 Morgan St Bergenfield, NJ 07621
Estimated Value: $571,387 - $668,000
--
Bed
--
Bath
1,482
Sq Ft
$425/Sq Ft
Est. Value
About This Home
This home is located at 37 Morgan St, Bergenfield, NJ 07621 and is currently estimated at $629,347, approximately $424 per square foot. 37 Morgan St is a home located in Bergen County with nearby schools including Bergenfield High School and Torah Academy of Bergen County.
Ownership History
Date
Name
Owned For
Owner Type
Purchase Details
Closed on
Jul 13, 2020
Sold by
Covais Andrea
Bought by
Westfall Maureen P
Current Estimated Value
Purchase Details
Closed on
Dec 30, 2008
Sold by
Colon Anibal and Colon Yolanda
Bought by
Brooks Francisco and Brooks Cristina
Purchase Details
Closed on
Feb 23, 1998
Sold by
Bifano Rosalie
Bought by
Colon Anibal and Colon Yolanda
Home Financials for this Owner
Home Financials are based on the most recent Mortgage that was taken out on this home.
Original Mortgage
$135,850
Interest Rate
6.9%
Create a Home Valuation Report for This Property
The Home Valuation Report is an in-depth analysis detailing your home's value as well as a comparison with similar homes in the area
Home Values in the Area
Average Home Value in this Area
Purchase History
| Date | Buyer | Sale Price | Title Company |
|---|---|---|---|
| Westfall Maureen P | $275,000 | American Land Title | |
| Westfall Maureen P | $275,000 | American Land Title | |
| Westfall Maureen P | $275,000 | American Land Title | |
| Brooks Francisco | $309,000 | -- | |
| Colon Anibal | $140,000 | -- |
Source: Public Records
Mortgage History
| Date | Status | Borrower | Loan Amount |
|---|---|---|---|
| Previous Owner | Colon Anibal | $135,850 |
Source: Public Records
Tax History Compared to Growth
Tax History
| Year | Tax Paid | Tax Assessment Tax Assessment Total Assessment is a certain percentage of the fair market value that is determined by local assessors to be the total taxable value of land and additions on the property. | Land | Improvement |
|---|---|---|---|---|
| 2025 | $10,447 | $296,200 | $161,300 | $134,900 |
| 2024 | $10,100 | $296,200 | $161,300 | $134,900 |
| 2023 | $9,943 | $296,200 | $161,300 | $134,900 |
| 2022 | $9,943 | $296,200 | $161,300 | $134,900 |
| 2021 | $9,840 | $296,200 | $161,300 | $134,900 |
| 2020 | $9,775 | $296,200 | $161,300 | $134,900 |
| 2019 | $9,662 | $296,200 | $161,300 | $134,900 |
| 2018 | $9,591 | $296,200 | $161,300 | $134,900 |
| 2017 | $9,544 | $296,200 | $161,300 | $134,900 |
| 2016 | $9,393 | $296,200 | $161,300 | $134,900 |
| 2015 | $9,247 | $296,200 | $161,300 | $134,900 |
| 2014 | $9,079 | $296,200 | $161,300 | $134,900 |
Source: Public Records
Map
Nearby Homes
- 15 Brown Place
- 70 Greenwich St
- 17 S Paula Dr
- 207 Melrose Ave
- 10 Judith Place
- 15 Westside Ave
- 14 Magnolia St
- 388 S Prospect Ave
- 6 Levitt Ave
- 55 Maiden Ln
- 14 Redwood St
- 98 John Place
- 42 Westview Dr
- 201 Maiden Ln
- 86 Levitt Ave
- 111 Dudley Dr
- 64 Madison Ave
- 16 Palisade Ave
- 135 Vreeland Ave
- 64 Glenwood Dr S