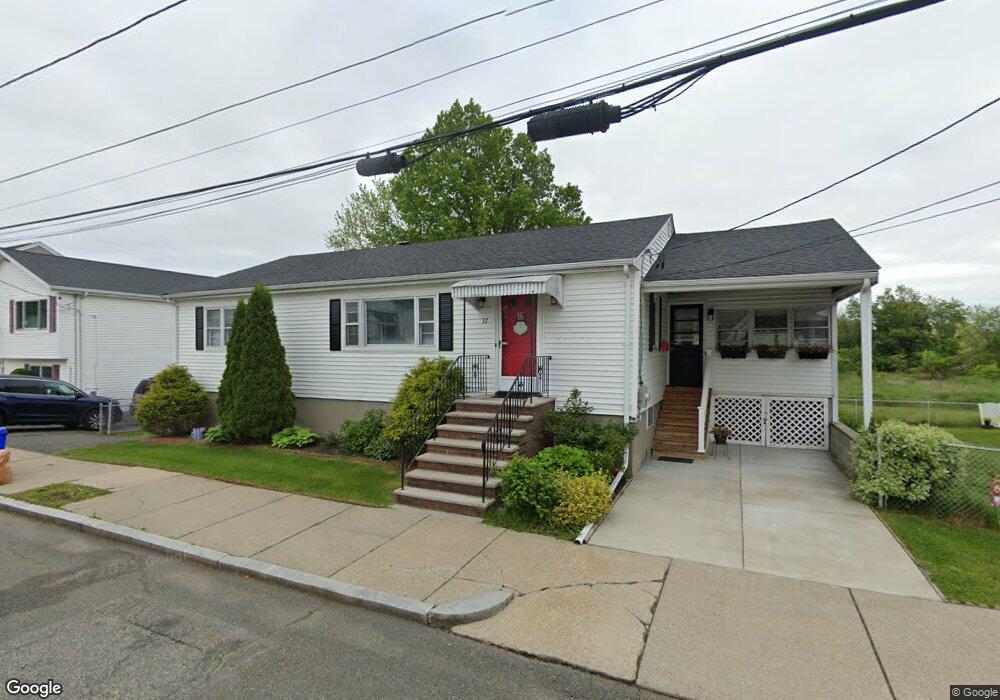
37 Morris St Malden, MA 02148
Linden NeighborhoodEstimated Value: $622,000 - $689,371
3
Beds
4
Baths
1,232
Sq Ft
$532/Sq Ft
Est. Value
About This Home
This home is located at 37 Morris St, Malden, MA 02148 and is currently estimated at $655,593, approximately $532 per square foot. 37 Morris St is a home located in Middlesex County with nearby schools including Malden High School and Malden Catholic.
Ownership History
Date
Name
Owned For
Owner Type
Purchase Details
Closed on
Oct 19, 2023
Sold by
Robicheau Charlene F
Bought by
Robicheau Michelle M
Current Estimated Value
Purchase Details
Closed on
Aug 12, 2022
Sold by
Moro Rosemarie Est and Moro
Bought by
Robicheau Charlene
Home Financials for this Owner
Home Financials are based on the most recent Mortgage that was taken out on this home.
Original Mortgage
$311,500
Interest Rate
5.3%
Mortgage Type
New Conventional
Create a Home Valuation Report for This Property
The Home Valuation Report is an in-depth analysis detailing your home's value as well as a comparison with similar homes in the area
Home Values in the Area
Average Home Value in this Area
Purchase History
| Date | Buyer | Sale Price | Title Company |
|---|---|---|---|
| Robicheau Michelle M | -- | None Available | |
| Robicheau Michelle M | -- | None Available | |
| Robicheau Charlene | -- | None Available | |
| Robicheau Charlene | -- | None Available | |
| Robicheau Charlene | -- | None Available |
Source: Public Records
Mortgage History
| Date | Status | Borrower | Loan Amount |
|---|---|---|---|
| Previous Owner | Robicheau Charlene | $311,500 |
Source: Public Records
Tax History Compared to Growth
Tax History
| Year | Tax Paid | Tax Assessment Tax Assessment Total Assessment is a certain percentage of the fair market value that is determined by local assessors to be the total taxable value of land and additions on the property. | Land | Improvement |
|---|---|---|---|---|
| 2025 | $66 | $587,200 | $316,200 | $271,000 |
| 2024 | $6,310 | $539,800 | $297,600 | $242,200 |
| 2023 | $6,051 | $496,400 | $269,700 | $226,700 |
| 2022 | $5,767 | $467,000 | $246,500 | $220,500 |
| 2021 | $5,472 | $445,200 | $232,500 | $212,700 |
| 2020 | $5,408 | $427,500 | $214,800 | $212,700 |
| 2019 | $5,210 | $392,600 | $204,600 | $188,000 |
| 2018 | $4,955 | $351,700 | $169,700 | $182,000 |
| 2017 | $4,984 | $351,700 | $169,700 | $182,000 |
| 2016 | $4,875 | $321,600 | $155,800 | $165,800 |
| 2015 | $4,772 | $303,400 | $148,300 | $155,100 |
| 2014 | $4,669 | $290,000 | $134,900 | $155,100 |
Source: Public Records
Map
Nearby Homes
- 33 Blaine St
- 75 Goldie St
- 770 Washington Ave Unit 405
- 690 Washington Ave
- 563 Lynn St
- 4 Anderson Way Unit 2
- 19 Bellvale St
- 70 Cecilian Ave
- 1135 Salem St
- 32 Delta Terrace
- 51 Keayne St
- 45 Assunta Rd
- 77 Roland Rd
- 87 Festa Rd
- 78 Festa Rd
- 144 Orvis Rd
- 109 Salem St Unit 405
- 10 Festa Rd
- 363 Broadway
- 112 Hadley St
- 41 Morris St
- 47 Morris St
- 27 Morris St
- 51 Morris St
- 21 Morris St
- 38 Morris St Unit B
- 38 Morris St Unit A
- 36 Morris St Unit 1
- 38 Morris St
- 38 Morris St Unit 1
- 40 Morris St
- 40 Morris St Unit 1B
- 40 Morrisst Unit 1B
- 50 Morris St
- 52 Morris St
- 34 Morris St
- 57 Morris St
- 15 Bradford St
- 32 Morris St
- 18 Morris St