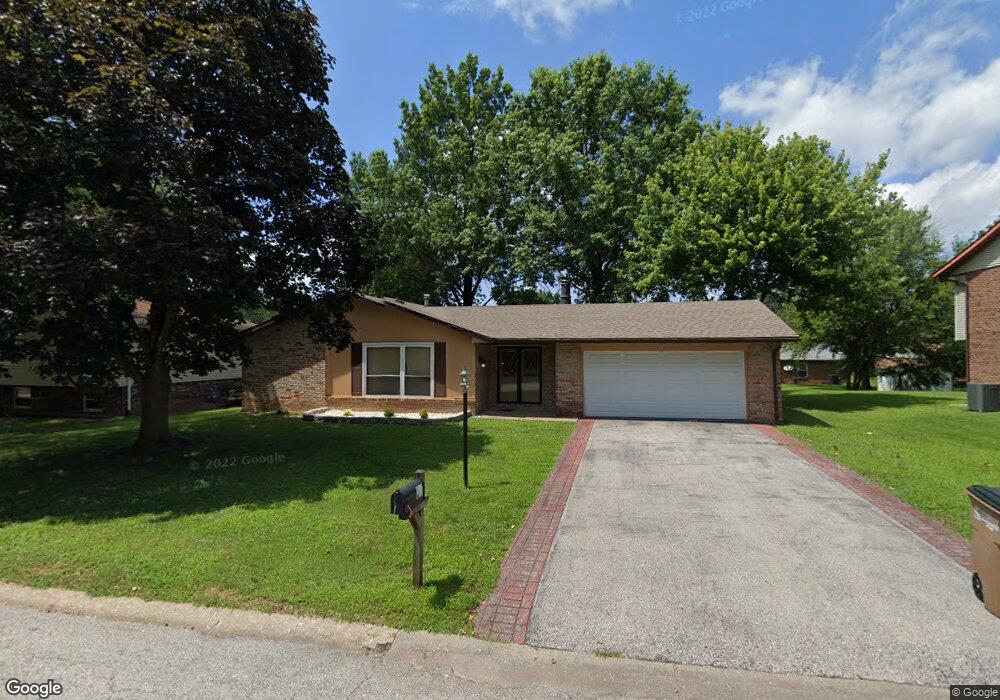
37 Morrison Dr Belleville, IL 62221
Estimated Value: $187,000 - $211,000
3
Beds
2
Baths
1,525
Sq Ft
$128/Sq Ft
Est. Value
About This Home
This home is located at 37 Morrison Dr, Belleville, IL 62221 and is currently estimated at $194,537, approximately $127 per square foot. 37 Morrison Dr is a home located in St. Clair County with nearby schools including Whiteside Elementary School, Whiteside Middle School, and St Teresa Catholic School.
Ownership History
Date
Name
Owned For
Owner Type
Purchase Details
Closed on
May 20, 2011
Sold by
The Secretary Of Housing & Urban Develop
Bought by
Parrett Kenneth
Current Estimated Value
Purchase Details
Closed on
Aug 27, 2010
Sold by
Howlett Jeffrey
Bought by
The Secretary Of Housing & Urban Develop
Purchase Details
Closed on
Sep 22, 2006
Sold by
Williams Carla and Howlett Carla D
Bought by
Howlett Jeffrey E and Howlett Carla D
Home Financials for this Owner
Home Financials are based on the most recent Mortgage that was taken out on this home.
Original Mortgage
$128,245
Interest Rate
6.58%
Mortgage Type
FHA
Purchase Details
Closed on
Oct 19, 2004
Sold by
Jones Harrie and Jones Jeanine M
Bought by
Williams Carla
Home Financials for this Owner
Home Financials are based on the most recent Mortgage that was taken out on this home.
Original Mortgage
$92,700
Interest Rate
7.2%
Mortgage Type
Purchase Money Mortgage
Create a Home Valuation Report for This Property
The Home Valuation Report is an in-depth analysis detailing your home's value as well as a comparison with similar homes in the area
Home Values in the Area
Average Home Value in this Area
Purchase History
| Date | Buyer | Sale Price | Title Company |
|---|---|---|---|
| Parrett Kenneth | -- | None Available | |
| The Secretary Of Housing & Urban Develop | -- | None Available | |
| Howlett Jeffrey E | -- | First American Title Insuran | |
| Williams Carla | $116,000 | Fatic |
Source: Public Records
Mortgage History
| Date | Status | Borrower | Loan Amount |
|---|---|---|---|
| Previous Owner | Howlett Jeffrey E | $128,245 | |
| Previous Owner | Williams Carla | $92,700 | |
| Closed | Williams Carla | $23,200 |
Source: Public Records
Tax History
| Year | Tax Paid | Tax Assessment Tax Assessment Total Assessment is a certain percentage of the fair market value that is determined by local assessors to be the total taxable value of land and additions on the property. | Land | Improvement |
|---|---|---|---|---|
| 2024 | $3,235 | $48,142 | $6,943 | $41,199 |
| 2023 | $2,993 | $43,398 | $6,847 | $36,551 |
| 2022 | $2,600 | $39,525 | $6,236 | $33,289 |
| 2021 | $2,551 | $37,903 | $5,980 | $31,923 |
| 2020 | $2,467 | $35,298 | $5,569 | $29,729 |
| 2019 | $2,289 | $33,798 | $6,080 | $27,718 |
| 2018 | $2,243 | $32,935 | $5,925 | $27,010 |
| 2017 | $2,268 | $32,059 | $5,768 | $26,291 |
| 2016 | $2,258 | $30,954 | $5,569 | $25,385 |
| 2014 | $1,992 | $29,620 | $5,556 | $24,064 |
| 2013 | $2,638 | $29,620 | $5,556 | $24,064 |
Source: Public Records
Map
Nearby Homes
- 2333 Greenfield Dr
- 120 Williamsburg Dr
- 330 Radcliff Rd
- 0 N Green Mount Rd
- 3241 Millbrook Dr
- 3416 Lebanon Ave
- 2421 Coniferous Dr
- 247 Caballeros Blvd
- 794 Cedar Mill Dr
- 3469 Chippewa Dr
- 3422 Chippewa Dr
- xxxx Christine Dr
- 2609 Greystone Estates Pkwy
- 108 Christine Dr
- 2605 Cheyenne Wells Dr
- 3402 Chippewa Dr
- 3404 Navajo Trail
- 2011 Lebanon Ave
- 6 & 10 Country Hill Ln
- 708 Santa fe Ct
- 41 Morrison Dr
- 33 Morrison Dr
- 204 Country Meadow Ln
- 208 Country Meadow Ln
- 116 Sierra Dr
- 45 Morrison Dr
- 29 Morrison Dr
- 36 Morrison Dr
- 32 Morrison Dr
- 212 Country Meadow Ln
- 28 Morrison Dr
- 25 Morrison Dr
- 25 Morrison Dr Unit B
- 25 Morrison Dr Unit A
- 216 Country Meadow Ln
- 44 Morrison Dr
- 24 Morrison Dr
- 201 Country Meadow Ln
- 25 Saint George Dr
Your Personal Tour Guide
Ask me questions while you tour the home.