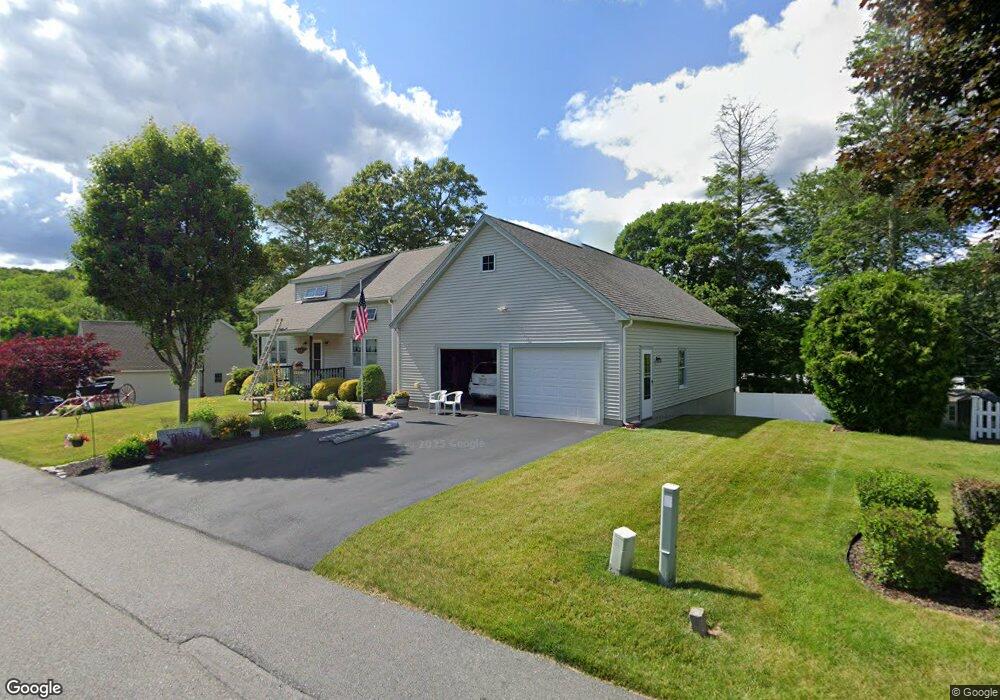
37 Old Cart Rd Auburn, MA 01501
Stoneville NeighborhoodEstimated Value: $570,000 - $624,388
3
Beds
3
Baths
1,360
Sq Ft
$438/Sq Ft
Est. Value
About This Home
This home is located at 37 Old Cart Rd, Auburn, MA 01501 and is currently estimated at $595,347, approximately $437 per square foot. 37 Old Cart Rd is a home located in Worcester County with nearby schools including Auburn Senior High School and Shrewsbury Montessori School - Auburn Campus.
Ownership History
Date
Name
Owned For
Owner Type
Purchase Details
Closed on
Jun 1, 2004
Sold by
Johnson Thomas M
Bought by
Young Daniel T and Young Marybeth A
Current Estimated Value
Home Financials for this Owner
Home Financials are based on the most recent Mortgage that was taken out on this home.
Original Mortgage
$280,000
Outstanding Balance
$135,772
Interest Rate
5.88%
Mortgage Type
Purchase Money Mortgage
Estimated Equity
$459,575
Create a Home Valuation Report for This Property
The Home Valuation Report is an in-depth analysis detailing your home's value as well as a comparison with similar homes in the area
Home Values in the Area
Average Home Value in this Area
Purchase History
| Date | Buyer | Sale Price | Title Company |
|---|---|---|---|
| Young Daniel T | $358,800 | -- | |
| Johnson Thomas M | -- | -- | |
| Johnson Thomas M | -- | -- |
Source: Public Records
Mortgage History
| Date | Status | Borrower | Loan Amount |
|---|---|---|---|
| Open | Young Daniel T | $280,000 | |
| Closed | Johnson Thomas M | $0 |
Source: Public Records
Tax History Compared to Growth
Tax History
| Year | Tax Paid | Tax Assessment Tax Assessment Total Assessment is a certain percentage of the fair market value that is determined by local assessors to be the total taxable value of land and additions on the property. | Land | Improvement |
|---|---|---|---|---|
| 2025 | $60 | $416,500 | $126,700 | $289,800 |
| 2024 | $6,041 | $404,600 | $120,900 | $283,700 |
| 2023 | $5,944 | $374,300 | $109,900 | $264,400 |
| 2022 | $5,567 | $331,000 | $109,900 | $221,100 |
| 2021 | $5,349 | $294,900 | $97,000 | $197,900 |
| 2020 | $11,139 | $287,100 | $97,000 | $190,100 |
| 2019 | $5,226 | $283,700 | $96,100 | $187,600 |
| 2018 | $10,432 | $275,700 | $89,800 | $185,900 |
| 2017 | $4,904 | $267,400 | $81,500 | $185,900 |
| 2016 | $4,801 | $265,400 | $85,100 | $180,300 |
| 2015 | $4,709 | $272,800 | $85,100 | $187,700 |
| 2014 | $4,566 | $264,100 | $81,000 | $183,100 |
Source: Public Records
Map
Nearby Homes