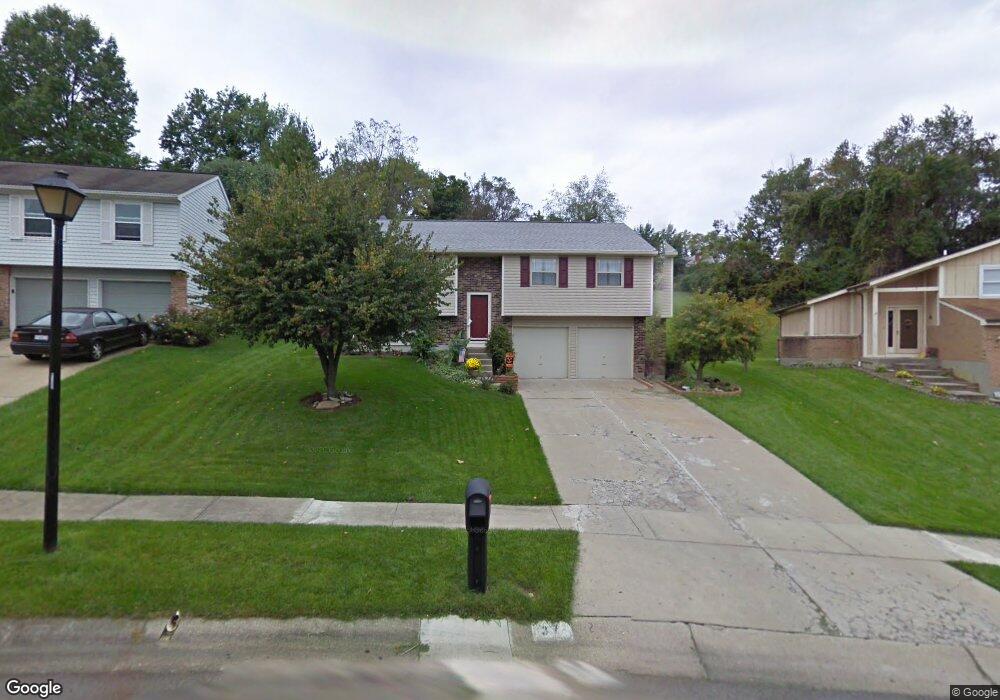
37 Orchard Knoll Dr Cincinnati, OH 45215
Estimated Value: $295,279 - $331,000
3
Beds
2
Baths
1,568
Sq Ft
$200/Sq Ft
Est. Value
About This Home
This home is located at 37 Orchard Knoll Dr, Cincinnati, OH 45215 and is currently estimated at $312,820, approximately $199 per square foot. 37 Orchard Knoll Dr is a home located in Hamilton County with nearby schools including Reading Community High School, Saints Peter and Paul Academy, and Mount Notre Dame High School.
Ownership History
Date
Name
Owned For
Owner Type
Purchase Details
Closed on
Jul 18, 2005
Sold by
Mobley Retha and Mobley Jerry
Bought by
Mobley Jerry and Mobley Retha
Current Estimated Value
Home Financials for this Owner
Home Financials are based on the most recent Mortgage that was taken out on this home.
Original Mortgage
$116,200
Interest Rate
5.74%
Mortgage Type
Fannie Mae Freddie Mac
Purchase Details
Closed on
Nov 11, 1993
Sold by
Mathys Beaulah M and Mathys Clifford A
Bought by
Monnin Retha
Home Financials for this Owner
Home Financials are based on the most recent Mortgage that was taken out on this home.
Original Mortgage
$61,350
Interest Rate
6.96%
Purchase Details
Closed on
Sep 29, 1993
Sold by
Woodin Katherine A
Bought by
Mathys Beaulah M
Home Financials for this Owner
Home Financials are based on the most recent Mortgage that was taken out on this home.
Original Mortgage
$61,350
Interest Rate
6.96%
Create a Home Valuation Report for This Property
The Home Valuation Report is an in-depth analysis detailing your home's value as well as a comparison with similar homes in the area
Home Values in the Area
Average Home Value in this Area
Purchase History
| Date | Buyer | Sale Price | Title Company |
|---|---|---|---|
| Mobley Jerry | -- | None Available | |
| Monnin Retha | -- | -- | |
| Mathys Beaulah M | -- | -- |
Source: Public Records
Mortgage History
| Date | Status | Borrower | Loan Amount |
|---|---|---|---|
| Closed | Mobley Jerry | $116,200 | |
| Closed | Monnin Retha | $61,350 |
Source: Public Records
Tax History Compared to Growth
Tax History
| Year | Tax Paid | Tax Assessment Tax Assessment Total Assessment is a certain percentage of the fair market value that is determined by local assessors to be the total taxable value of land and additions on the property. | Land | Improvement |
|---|---|---|---|---|
| 2024 | $3,351 | $74,715 | $13,965 | $60,750 |
| 2023 | $3,442 | $74,715 | $13,965 | $60,750 |
| 2022 | $3,296 | $57,400 | $11,970 | $45,430 |
| 2021 | $2,743 | $57,400 | $11,970 | $45,430 |
| 2020 | $2,783 | $57,400 | $11,970 | $45,430 |
| 2019 | $2,447 | $47,835 | $9,975 | $37,860 |
| 2018 | $2,450 | $47,835 | $9,975 | $37,860 |
| 2017 | $2,303 | $47,835 | $9,975 | $37,860 |
| 2016 | $2,167 | $45,815 | $10,290 | $35,525 |
| 2015 | $2,194 | $45,815 | $10,290 | $35,525 |
| 2014 | $1,919 | $45,815 | $10,290 | $35,525 |
| 2013 | $1,954 | $46,750 | $10,500 | $36,250 |
Source: Public Records
Map
Nearby Homes
- 21 Orchard Knoll Dr
- 69 Orchard Knoll Dr
- 234 Mcguire Ln
- 1521 Hunt Rd
- 310 E Vine St
- 109 Calico Ct
- 2132 Trailridge Dr
- 1955 Hunt Rd
- 1009 5th St
- 9 W North St
- 18 Gahl Terrace
- 16 Gahl Terrace
- 8914 Reading Rd
- 1246 Thurnridge Dr
- 796 Kenray Ct
- 1626 Krylon Dr
- 636 Maple Dr
- 134 Walnut St
- 1013 Market St
- 797 4th St
- 33 Orchard Knoll Dr
- 41 Orchard Knoll Dr
- 29 Orchard Knoll Dr
- 45 Orchard Knoll Dr
- 54 Orchard Knoll Dr
- 50 Orchard Knoll Dr
- 25 Orchard Knoll Dr
- 25 Orchard Trail
- 49 Orchard Knoll Dr
- 46 Orchard Knoll Dr
- 412 E Columbia Ave
- 404 E Columbia Ave
- 414 E Columbia Ave
- 42 Orchard Knoll Dr
- 436 E Columbia Ave
- 396 E Columbia Ave
- 400 E Columbia Ave
- 420 E Columbia Ave
- 420 E Columbia Ave
- 62 Orchard Knoll Dr