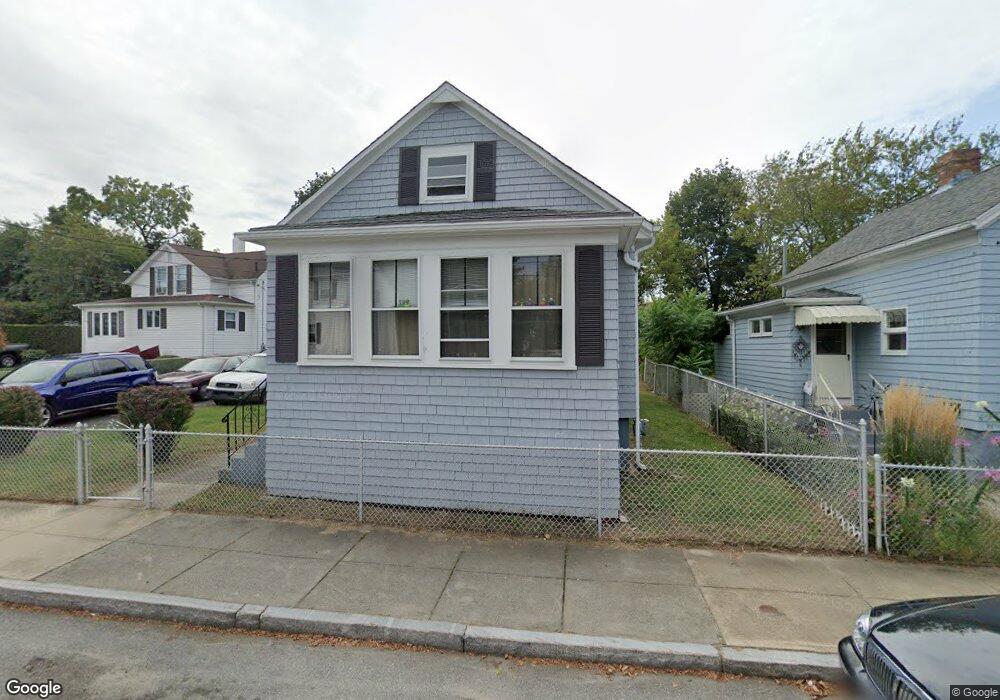
37 Pebble St Fall River, MA 02721
Maplewood NeighborhoodEstimated Value: $262,000 - $313,849
1
Bed
1
Bath
700
Sq Ft
$412/Sq Ft
Est. Value
About This Home
This home is located at 37 Pebble St, Fall River, MA 02721 and is currently estimated at $288,712, approximately $412 per square foot. 37 Pebble St is a home located in Bristol County with nearby schools including Letourneau Elementary School, Matthew J. Kuss Middle School, and B M C Durfee High School.
Ownership History
Date
Name
Owned For
Owner Type
Purchase Details
Closed on
May 22, 2009
Sold by
Masciarelli Benjamin
Bought by
Nanni Vincent M
Current Estimated Value
Purchase Details
Closed on
Jan 31, 2005
Sold by
Masciarelli Bertha and Masciarelli Bertionio
Bought by
Masciarelli Benjamin
Purchase Details
Closed on
Apr 13, 1993
Sold by
Raposa Henry J Est
Bought by
Masciarelli Bertionio and Masciarelli Bertha
Home Financials for this Owner
Home Financials are based on the most recent Mortgage that was taken out on this home.
Original Mortgage
$30,000
Interest Rate
7.48%
Mortgage Type
Purchase Money Mortgage
Create a Home Valuation Report for This Property
The Home Valuation Report is an in-depth analysis detailing your home's value as well as a comparison with similar homes in the area
Home Values in the Area
Average Home Value in this Area
Purchase History
| Date | Buyer | Sale Price | Title Company |
|---|---|---|---|
| Nanni Vincent M | $107,000 | -- | |
| Masciarelli Benjamin | -- | -- | |
| Masciarelli Bertionio | $64,000 | -- |
Source: Public Records
Mortgage History
| Date | Status | Borrower | Loan Amount |
|---|---|---|---|
| Previous Owner | Masciarelli Bertionio | $30,000 |
Source: Public Records
Tax History
| Year | Tax Paid | Tax Assessment Tax Assessment Total Assessment is a certain percentage of the fair market value that is determined by local assessors to be the total taxable value of land and additions on the property. | Land | Improvement |
|---|---|---|---|---|
| 2025 | $3,106 | $271,300 | $127,500 | $143,800 |
| 2024 | $2,946 | $256,400 | $122,600 | $133,800 |
| 2023 | $2,825 | $230,200 | $105,100 | $125,100 |
| 2022 | $2,523 | $199,900 | $95,600 | $104,300 |
| 2021 | $2,409 | $174,200 | $88,400 | $85,800 |
| 2020 | $2,283 | $158,000 | $84,600 | $73,400 |
| 2019 | $2,203 | $151,100 | $80,600 | $70,500 |
| 2018 | $2,177 | $148,900 | $79,100 | $69,800 |
| 2017 | $2,090 | $149,300 | $80,700 | $68,600 |
| 2016 | $2,031 | $149,000 | $84,100 | $64,900 |
| 2015 | $1,953 | $149,300 | $80,900 | $68,400 |
| 2014 | $1,932 | $153,600 | $85,200 | $68,400 |
Source: Public Records
Map
Nearby Homes
Your Personal Tour Guide
Ask me questions while you tour the home.