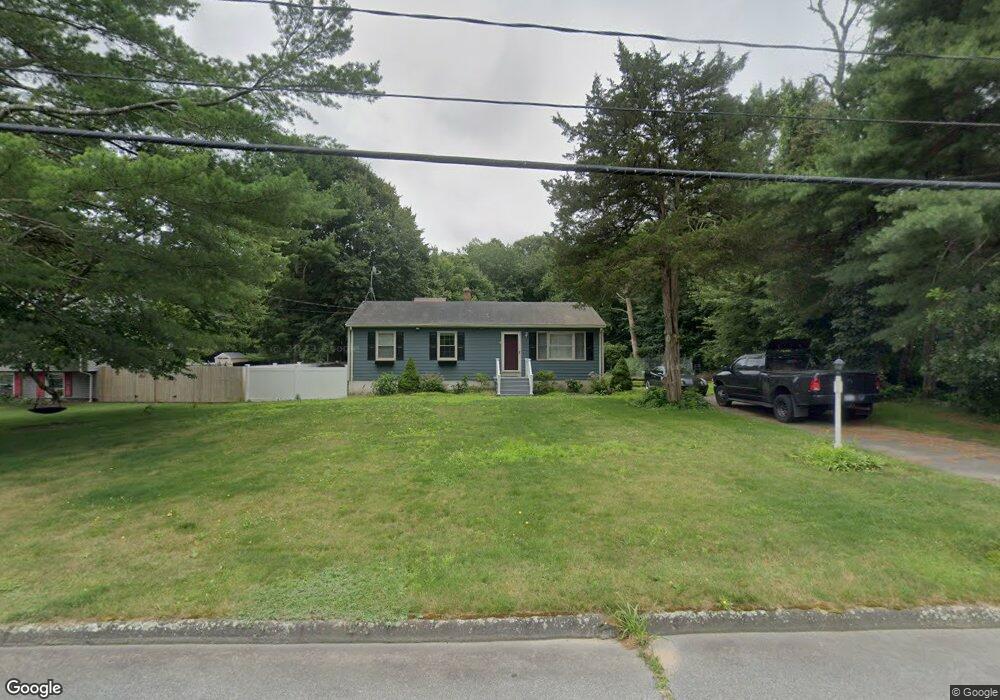
37 Pembroke Dr North Dartmouth, MA 02747
Estimated Value: $338,000 - $515,000
3
Beds
1
Bath
1,008
Sq Ft
$447/Sq Ft
Est. Value
About This Home
This home is located at 37 Pembroke Dr, North Dartmouth, MA 02747 and is currently estimated at $451,076, approximately $447 per square foot. 37 Pembroke Dr is a home located in Bristol County with nearby schools including Dartmouth High School.
Ownership History
Date
Name
Owned For
Owner Type
Purchase Details
Closed on
Dec 13, 2023
Sold by
Desousa Nelson and Lakeview Loan Servicing L
Bought by
Hilchey Theodore
Current Estimated Value
Purchase Details
Closed on
Mar 24, 2011
Sold by
Hsbc Bank Usa Na
Bought by
Desousa Nelson
Home Financials for this Owner
Home Financials are based on the most recent Mortgage that was taken out on this home.
Original Mortgage
$178,694
Interest Rate
5.07%
Purchase Details
Closed on
Aug 20, 2010
Sold by
Seguin Dennis and Hsbc Bank Usa
Bought by
Hsbc Bank Usa
Purchase Details
Closed on
Jan 10, 2001
Sold by
Gaumont Jennifer S
Bought by
Seguin Dennis H
Purchase Details
Closed on
Apr 21, 1989
Sold by
Gaumont Gary R
Bought by
Gaumont Jennifer S
Create a Home Valuation Report for This Property
The Home Valuation Report is an in-depth analysis detailing your home's value as well as a comparison with similar homes in the area
Home Values in the Area
Average Home Value in this Area
Purchase History
| Date | Buyer | Sale Price | Title Company |
|---|---|---|---|
| Hilchey Theodore | $341,000 | None Available | |
| Hilchey Theodore | $341,000 | None Available | |
| Desousa Nelson | $165,000 | -- | |
| Desousa Nelson | $165,000 | -- | |
| Hsbc Bank Usa | $216,270 | -- | |
| Seguin Dennis H | $139,900 | -- | |
| Gaumont Jennifer S | $25,000 | -- | |
| Desousa Nelson | $165,000 | -- | |
| Hsbc Bank Usa | $216,270 | -- | |
| Seguin Dennis H | $139,900 | -- | |
| Gaumont Jennifer S | $25,000 | -- |
Source: Public Records
Mortgage History
| Date | Status | Borrower | Loan Amount |
|---|---|---|---|
| Previous Owner | Gaumont Jennifer S | $178,694 | |
| Previous Owner | Gaumont Jennifer S | $200,000 |
Source: Public Records
Tax History Compared to Growth
Tax History
| Year | Tax Paid | Tax Assessment Tax Assessment Total Assessment is a certain percentage of the fair market value that is determined by local assessors to be the total taxable value of land and additions on the property. | Land | Improvement |
|---|---|---|---|---|
| 2025 | $2,828 | $306,700 | $152,500 | $154,200 |
| 2024 | $2,774 | $299,600 | $152,500 | $147,100 |
| 2023 | $2,826 | $285,500 | $152,500 | $133,000 |
| 2022 | $2,832 | $263,400 | $152,500 | $110,900 |
| 2021 | $6,676 | $255,400 | $148,000 | $107,400 |
| 2020 | $6,725 | $249,200 | $146,500 | $102,700 |
| 2019 | $6,695 | $242,100 | $140,600 | $101,500 |
| 2018 | $2,567 | $233,600 | $143,600 | $90,000 |
| 2017 | $2,407 | $221,200 | $132,700 | $88,500 |
| 2016 | $2,210 | $200,500 | $117,400 | $83,100 |
| 2015 | $2,133 | $193,900 | $109,700 | $84,200 |
| 2014 | $2,089 | $189,200 | $106,700 | $82,500 |
Source: Public Records
Map
Nearby Homes
- 27 Woodcock Rd
- 434 Gulf Rd W
- 1150 Russells Mills Rd
- 14 Westview Dr
- 4 Rileys Way
- 10 Westview Dr
- 248 Bakerville Rd
- 2 Slades Farm Ln
- 16 Gulf Hill Dr
- 9 Division Rd
- 34 Country Way
- 17 Eighth Green Dr
- 1 Masthead Ln
- 75 Country Way Unit 75
- 360 Russells Mills Rd
- Lot 6 Rafael Rd
- 61 Pardon Hill Rd
- 24 Wayne Memorial Dr
- Lot 2E Horseneck Rd
- 6 Jacob Dr