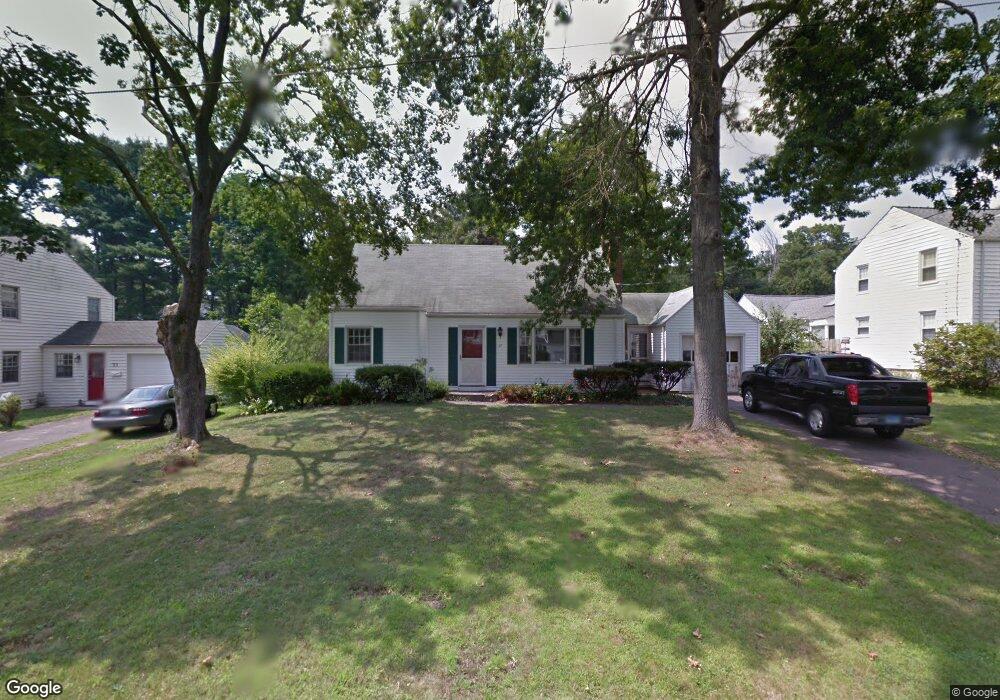
37 Plainfield Rd West Hartford, CT 06117
Estimated Value: $451,823 - $518,000
4
Beds
2
Baths
1,554
Sq Ft
$315/Sq Ft
Est. Value
About This Home
This home is located at 37 Plainfield Rd, West Hartford, CT 06117 and is currently estimated at $489,956, approximately $315 per square foot. 37 Plainfield Rd is a home located in Hartford County with nearby schools including Norfeldt School, King Philip Middle School, and Hall High School.
Ownership History
Date
Name
Owned For
Owner Type
Purchase Details
Closed on
Jul 16, 2018
Sold by
Garcia Gustavo and Bentham Nina
Bought by
Weber Denita
Current Estimated Value
Home Financials for this Owner
Home Financials are based on the most recent Mortgage that was taken out on this home.
Original Mortgage
$224,000
Outstanding Balance
$194,129
Interest Rate
4.5%
Mortgage Type
Purchase Money Mortgage
Estimated Equity
$295,827
Purchase Details
Closed on
Jan 28, 2003
Sold by
Conley Paul D and Lundquist Mary
Bought by
Garcia Gustavo and Bentham Nina
Home Financials for this Owner
Home Financials are based on the most recent Mortgage that was taken out on this home.
Original Mortgage
$212,000
Interest Rate
8.5%
Purchase Details
Closed on
Sep 30, 1996
Sold by
Dresty Barbara
Bought by
Conley Paul and Lundquist Mary
Home Financials for this Owner
Home Financials are based on the most recent Mortgage that was taken out on this home.
Original Mortgage
$123,500
Interest Rate
7.83%
Mortgage Type
Unknown
Create a Home Valuation Report for This Property
The Home Valuation Report is an in-depth analysis detailing your home's value as well as a comparison with similar homes in the area
Home Values in the Area
Average Home Value in this Area
Purchase History
| Date | Buyer | Sale Price | Title Company |
|---|---|---|---|
| Weber Denita | $250,000 | -- | |
| Garcia Gustavo | $236,000 | -- | |
| Conley Paul | $130,000 | -- |
Source: Public Records
Mortgage History
| Date | Status | Borrower | Loan Amount |
|---|---|---|---|
| Open | Weber Denita | $224,000 | |
| Previous Owner | Conley Paul | $212,200 | |
| Previous Owner | Conley Paul | $212,000 | |
| Previous Owner | Conley Paul | $123,500 |
Source: Public Records
Tax History Compared to Growth
Tax History
| Year | Tax Paid | Tax Assessment Tax Assessment Total Assessment is a certain percentage of the fair market value that is determined by local assessors to be the total taxable value of land and additions on the property. | Land | Improvement |
|---|---|---|---|---|
| 2025 | $9,228 | $206,080 | $95,270 | $110,810 |
| 2024 | $8,727 | $206,080 | $95,270 | $110,810 |
| 2023 | $8,433 | $206,080 | $95,270 | $110,810 |
| 2022 | $8,383 | $206,080 | $95,270 | $110,810 |
| 2021 | $7,765 | $183,050 | $91,560 | $91,490 |
| 2020 | $7,251 | $173,460 | $83,370 | $90,090 |
| 2019 | $7,239 | $173,180 | $83,370 | $89,810 |
| 2018 | $7,100 | $173,180 | $83,370 | $89,810 |
| 2017 | $7,107 | $173,180 | $83,370 | $89,810 |
| 2016 | $7,088 | $179,410 | $78,890 | $100,520 |
| 2015 | $6,873 | $179,410 | $78,890 | $100,520 |
| 2014 | $6,705 | $179,410 | $78,890 | $100,520 |
Source: Public Records
Map
Nearby Homes
- 21 Barksdale Rd
- 10 Hosmer Dr
- 36 Richmond Ln
- 75 Arlen Way
- 10 Ironwood Ln
- 40 Ferncliff Dr
- 592 Mountain Rd Unit A
- 11 Rye Ridge Pkwy
- 50 Magnolia Hill
- 17 Cranbrook
- 2581 Albany Ave
- 25 Lakeview Dr
- 30 Farmstead Ln
- 47 Flagg Rd
- 124 High Ridge Rd
- 62 Blue Ridge Ln
- 1 Cedar Close
- 365 Simsbury Rd
- 148 King Philip Dr
- 16 Morningcrest Dr
- 33 Plainfield Rd
- 41 Plainfield Rd
- 31 Plainfield Rd
- 708 Mountain Rd
- 712 Mountain Rd
- 704 Mountain Rd
- 38 Plainfield Rd
- 36 Plainfield Rd
- 29 Plainfield Rd
- 40 Plainfield Rd
- 702 Mountain Rd
- 10 Lostbrook Rd
- 14 Lostbrook Rd
- 32 Plainfield Rd
- 4 Lostbrook Rd
- 18 Lostbrook Rd
- 700 Mountain Rd
- 25 Plainfield Rd
- 30 Plainfield Rd
- 720 Mountain Rd