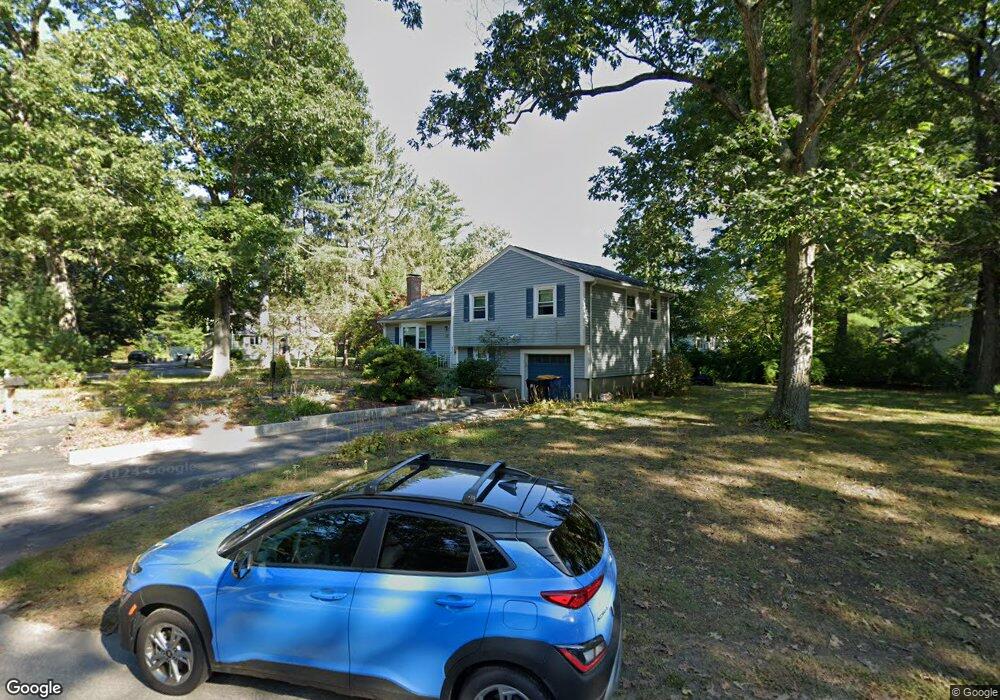
37 Pole Plain Rd Unit 1 Sharon, MA 02067
Estimated Value: $732,000 - $803,000
4
Beds
3
Baths
2,000
Sq Ft
$376/Sq Ft
Est. Value
About This Home
This home is located at 37 Pole Plain Rd Unit 1, Sharon, MA 02067 and is currently estimated at $751,651, approximately $375 per square foot. 37 Pole Plain Rd Unit 1 is a home located in Norfolk County with nearby schools including Heights Elementary School, Sharon Middle School, and Sharon High School.
Ownership History
Date
Name
Owned For
Owner Type
Purchase Details
Closed on
Sep 22, 2020
Sold by
Ford Thomas K
Bought by
Maher Stephen and Brown Stacey M
Current Estimated Value
Home Financials for this Owner
Home Financials are based on the most recent Mortgage that was taken out on this home.
Original Mortgage
$463,250
Outstanding Balance
$411,104
Interest Rate
2.9%
Mortgage Type
New Conventional
Estimated Equity
$340,547
Purchase Details
Closed on
Dec 17, 2008
Sold by
Ames Anita M and Ames Alan B
Bought by
Ford Thomas K
Purchase Details
Closed on
Sep 29, 2004
Sold by
Ames Alan B and Ames Alan M
Bought by
Ames Alan B and Ames Anita
Home Financials for this Owner
Home Financials are based on the most recent Mortgage that was taken out on this home.
Original Mortgage
$299,400
Interest Rate
5.81%
Create a Home Valuation Report for This Property
The Home Valuation Report is an in-depth analysis detailing your home's value as well as a comparison with similar homes in the area
Home Values in the Area
Average Home Value in this Area
Purchase History
| Date | Buyer | Sale Price | Title Company |
|---|---|---|---|
| Maher Stephen | $545,000 | None Available | |
| Ford Thomas K | $250,000 | -- | |
| Ames Alan B | -- | -- |
Source: Public Records
Mortgage History
| Date | Status | Borrower | Loan Amount |
|---|---|---|---|
| Open | Maher Stephen | $463,250 | |
| Previous Owner | Ames Alan B | $299,400 |
Source: Public Records
Tax History
| Year | Tax Paid | Tax Assessment Tax Assessment Total Assessment is a certain percentage of the fair market value that is determined by local assessors to be the total taxable value of land and additions on the property. | Land | Improvement |
|---|---|---|---|---|
| 2025 | $10,588 | $605,700 | $368,200 | $237,500 |
| 2024 | $9,940 | $565,400 | $337,700 | $227,700 |
| 2023 | $9,728 | $523,300 | $315,700 | $207,600 |
| 2022 | $9,006 | $456,000 | $263,000 | $193,000 |
| 2021 | $8,903 | $435,800 | $248,200 | $187,600 |
| 2020 | $8,280 | $435,800 | $248,200 | $187,600 |
| 2019 | $7,904 | $407,200 | $219,600 | $187,600 |
| 2018 | $7,804 | $402,900 | $215,300 | $187,600 |
| 2017 | $7,630 | $388,900 | $201,300 | $187,600 |
| 2016 | $7,491 | $372,500 | $201,300 | $171,200 |
| 2015 | $7,052 | $347,400 | $184,600 | $162,800 |
| 2014 | $6,525 | $317,500 | $167,800 | $149,700 |
Source: Public Records
Map
Nearby Homes
- 27 Sandy Ridge Cir
- 180 Old Post Rd Unit 202
- 180 Old Post Rd Unit 206
- 180 Old Post Rd Unit 308
- 180 Old Post Rd Unit 201
- 180 Old Post Rd Unit 405
- 180 Old Post Rd Unit 207
- 668 S Main St
- 5 Trowel Pond Shop Rd Unit C
- 277 Everett St
- 54 Depot St
- 58 Ames St
- 29 Station St
- 0 U S Route 1
- 32 Billings St Unit A
- Lot One Old Wolomolopoag St
- Lot Two Old Wolomolopoag St
- 15 Paul Revere Rd
- 635 Old Post Rd Unit 303
- 635 Old Post Rd Unit 302
Your Personal Tour Guide
Ask me questions while you tour the home.