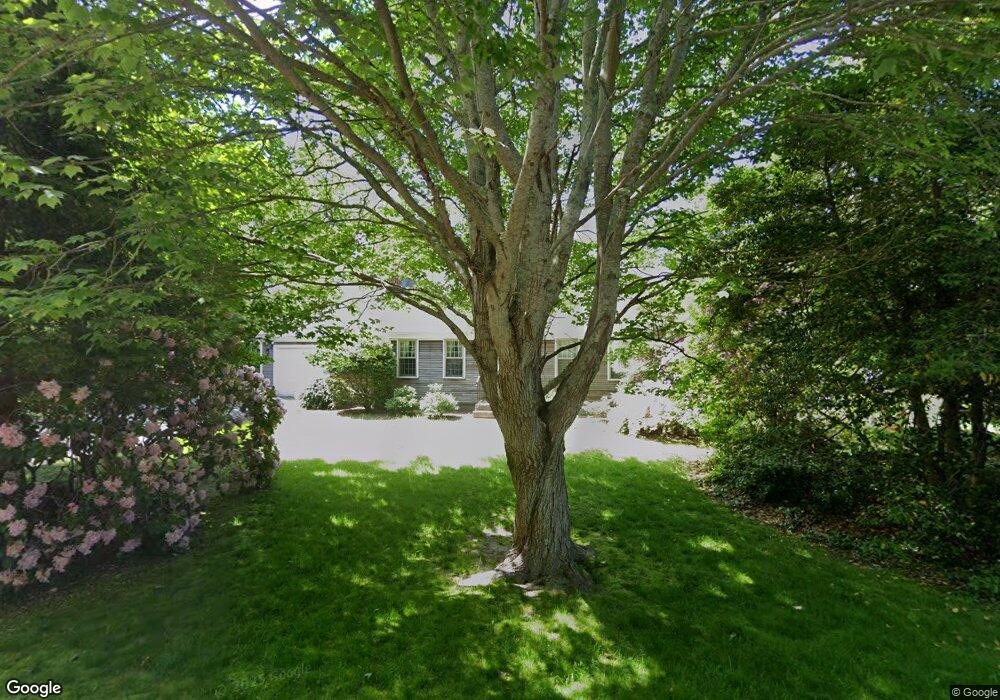
37 Ridge Rd West Barnstable, MA 02668
West Barnstable NeighborhoodEstimated Value: $608,031 - $724,000
3
Beds
2
Baths
1,358
Sq Ft
$483/Sq Ft
Est. Value
About This Home
This home is located at 37 Ridge Rd, West Barnstable, MA 02668 and is currently estimated at $656,008, approximately $483 per square foot. 37 Ridge Rd is a home located in Barnstable County with nearby schools including West Barnstable Elementary School, Barnstable United Elementary School, and Barnstable Intermediate School.
Ownership History
Date
Name
Owned For
Owner Type
Purchase Details
Closed on
Nov 25, 2011
Sold by
Est Guest Dorothy S and Guest William T
Bought by
Avery Nicholas J and Avery Paula S
Current Estimated Value
Home Financials for this Owner
Home Financials are based on the most recent Mortgage that was taken out on this home.
Original Mortgage
$289,701
Outstanding Balance
$201,847
Interest Rate
4.4%
Mortgage Type
FHA
Estimated Equity
$454,161
Create a Home Valuation Report for This Property
The Home Valuation Report is an in-depth analysis detailing your home's value as well as a comparison with similar homes in the area
Home Values in the Area
Average Home Value in this Area
Purchase History
| Date | Buyer | Sale Price | Title Company |
|---|---|---|---|
| Avery Nicholas J | $23,000 | -- |
Source: Public Records
Mortgage History
| Date | Status | Borrower | Loan Amount |
|---|---|---|---|
| Open | Avery Nicholas J | $289,701 |
Source: Public Records
Tax History
| Year | Tax Paid | Tax Assessment Tax Assessment Total Assessment is a certain percentage of the fair market value that is determined by local assessors to be the total taxable value of land and additions on the property. | Land | Improvement |
|---|---|---|---|---|
| 2025 | $4,842 | $518,400 | $151,900 | $366,500 |
| 2024 | $4,288 | $499,800 | $151,900 | $347,900 |
| 2023 | $4,077 | $447,500 | $138,100 | $309,400 |
| 2022 | $4,071 | $366,400 | $102,300 | $264,100 |
| 2021 | $3,825 | $326,400 | $102,300 | $224,100 |
| 2020 | $4,031 | $332,600 | $122,800 | $209,800 |
| 2019 | $3,795 | $309,000 | $122,800 | $186,200 |
| 2018 | $3,679 | $296,900 | $134,600 | $162,300 |
| 2017 | $3,541 | $289,300 | $134,600 | $154,700 |
| 2016 | $3,481 | $290,300 | $135,600 | $154,700 |
| 2015 | $3,436 | $287,300 | $131,300 | $156,000 |
Source: Public Records
Map
Nearby Homes
Your Personal Tour Guide
Ask me questions while you tour the home.