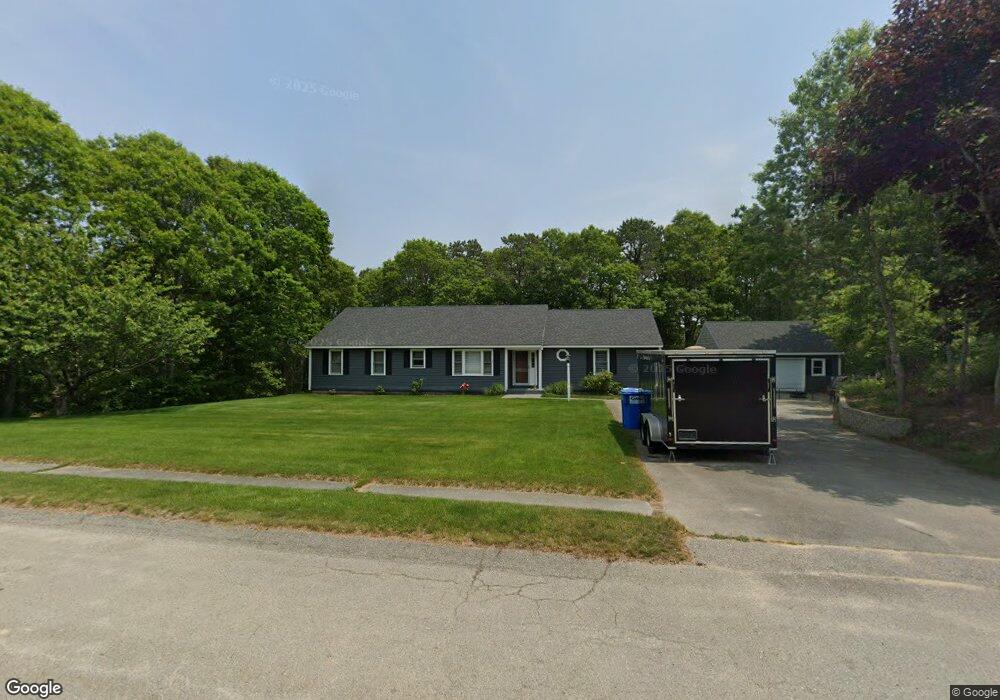
37 Rooks Run Plymouth, MA 02360
Estimated Value: $602,000 - $710,000
3
Beds
3
Baths
2,004
Sq Ft
$331/Sq Ft
Est. Value
About This Home
This home is located at 37 Rooks Run, Plymouth, MA 02360 and is currently estimated at $663,144, approximately $330 per square foot. 37 Rooks Run is a home located in Plymouth County with nearby schools including South Elementary School, Plymouth South Middle School, and Plymouth South High School.
Ownership History
Date
Name
Owned For
Owner Type
Purchase Details
Closed on
Mar 14, 2022
Sold by
Jacques Allen H Est and Jacques
Bought by
Jacques Cory A and Jacques Donna E
Current Estimated Value
Home Financials for this Owner
Home Financials are based on the most recent Mortgage that was taken out on this home.
Original Mortgage
$190,000
Outstanding Balance
$176,765
Interest Rate
3.55%
Mortgage Type
Purchase Money Mortgage
Estimated Equity
$486,379
Create a Home Valuation Report for This Property
The Home Valuation Report is an in-depth analysis detailing your home's value as well as a comparison with similar homes in the area
Home Values in the Area
Average Home Value in this Area
Purchase History
| Date | Buyer | Sale Price | Title Company |
|---|---|---|---|
| Jacques Cory A | $185,000 | None Available |
Source: Public Records
Mortgage History
| Date | Status | Borrower | Loan Amount |
|---|---|---|---|
| Open | Jacques Cory A | $190,000 |
Source: Public Records
Tax History Compared to Growth
Tax History
| Year | Tax Paid | Tax Assessment Tax Assessment Total Assessment is a certain percentage of the fair market value that is determined by local assessors to be the total taxable value of land and additions on the property. | Land | Improvement |
|---|---|---|---|---|
| 2025 | $7,284 | $574,000 | $205,700 | $368,300 |
| 2024 | $6,930 | $538,500 | $195,700 | $342,800 |
| 2023 | $6,803 | $496,200 | $177,700 | $318,500 |
| 2022 | $6,197 | $401,600 | $162,400 | $239,200 |
| 2021 | $5,970 | $369,400 | $162,400 | $207,000 |
| 2020 | $5,584 | $341,500 | $162,400 | $179,100 |
| 2019 | $5,304 | $320,700 | $147,400 | $173,300 |
| 2018 | $5,081 | $308,700 | $137,400 | $171,300 |
| 2017 | $4,883 | $294,500 | $137,400 | $157,100 |
| 2016 | $4,655 | $286,100 | $127,400 | $158,700 |
| 2015 | $4,176 | $268,700 | $117,400 | $151,300 |
| 2014 | $3,997 | $264,200 | $117,400 | $146,800 |
Source: Public Records
Map
Nearby Homes
- 756 Bourne Rd
- 8 Joyce Dr
- 72 Kirk Cir
- 7 Central Ave
- 32 Lake View Blvd
- 18 Scarlet Dr
- 35 Scarlet Dr
- 4 Sandpiper Ln
- 119 Nathan Ln
- 137 Sandy Beach Rd
- 455 Lunns Way
- 249 Little Sandy Pond Rd
- 464 Lunns Way
- 8 Cabot Cir
- 12 Squirrel Rd
- 118 Puritan Ave
- 2 Wind Rose Ln
- 637 Wareham Rd
- 15 S Wind Dr
- 284 Plymouth Ave