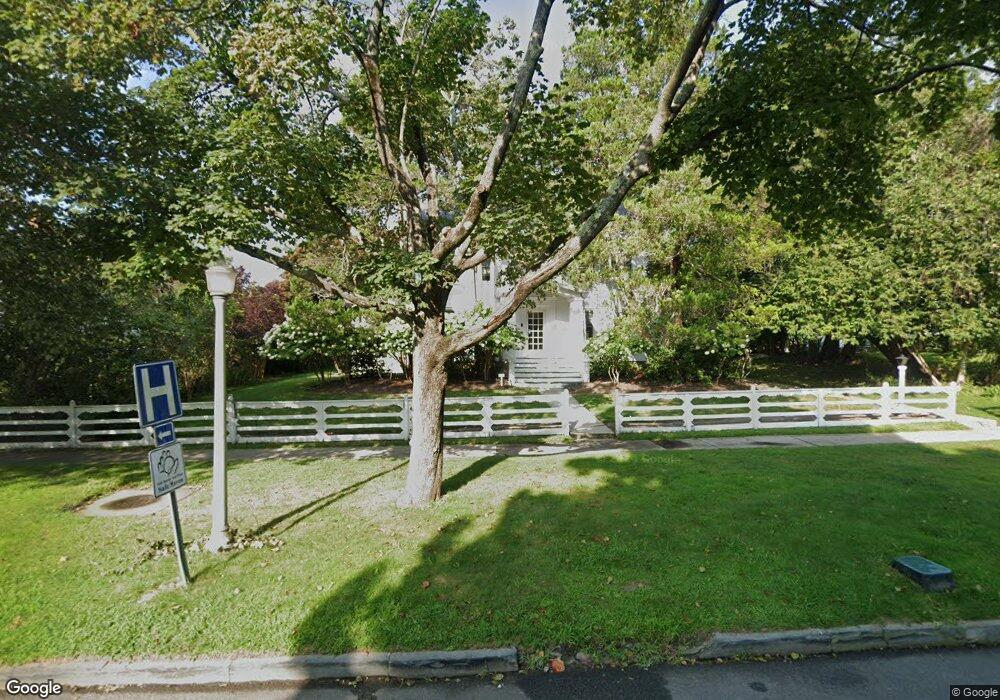
37 S Main St Southampton, NY 11968
Estimated Value: $4,863,366 - $6,281,000
6
Beds
5
Baths
3,577
Sq Ft
$1,570/Sq Ft
Est. Value
About This Home
This home is located at 37 S Main St, Southampton, NY 11968 and is currently estimated at $5,615,092, approximately $1,569 per square foot. 37 S Main St is a home located in Suffolk County with nearby schools including Southampton Elementary School, Southampton Intermediate School, and Southampton High School.
Ownership History
Date
Name
Owned For
Owner Type
Purchase Details
Closed on
Jun 30, 2003
Sold by
Johnson Ann F and Navarre Sara Johnson
Bought by
Johnson Navarre Properties Llc
Current Estimated Value
Purchase Details
Closed on
Jul 11, 2000
Sold by
Johnson Mary F and Johnson John M
Bought by
Johnson Mary F and Navarre Sara Johnson
Purchase Details
Closed on
Sep 16, 1994
Sold by
Johnson John M and Johnson John M
Bought by
Johnson John M and Johnson John M
Create a Home Valuation Report for This Property
The Home Valuation Report is an in-depth analysis detailing your home's value as well as a comparison with similar homes in the area
Home Values in the Area
Average Home Value in this Area
Purchase History
| Date | Buyer | Sale Price | Title Company |
|---|---|---|---|
| Johnson Navarre Properties Llc | -- | Commonwealth Land Title Ins | |
| Johnson Mary F | -- | Fidelity National Title Ins | |
| Johnson John M | -- | Chicago Title Insurance Co |
Source: Public Records
Tax History Compared to Growth
Tax History
| Year | Tax Paid | Tax Assessment Tax Assessment Total Assessment is a certain percentage of the fair market value that is determined by local assessors to be the total taxable value of land and additions on the property. | Land | Improvement |
|---|---|---|---|---|
| 2024 | $3,145 | $3,838,900 | $3,380,800 | $458,100 |
| 2023 | $3,145 | $3,838,900 | $3,380,800 | $458,100 |
| 2022 | $10,388 | $3,838,900 | $3,380,800 | $458,100 |
| 2021 | $10,388 | $3,838,900 | $3,380,800 | $458,100 |
| 2020 | $13,700 | $3,838,900 | $3,380,800 | $458,100 |
| 2019 | $13,598 | $0 | $0 | $0 |
| 2018 | -- | $3,708,400 | $3,217,600 | $490,800 |
| 2017 | $11,202 | $3,708,400 | $3,217,600 | $490,800 |
| 2016 | $11,696 | $3,708,400 | $3,217,600 | $490,800 |
| 2015 | -- | $3,172,100 | $2,681,300 | $490,800 |
| 2014 | -- | $3,172,100 | $2,681,300 | $490,800 |
Source: Public Records
Map
Nearby Homes