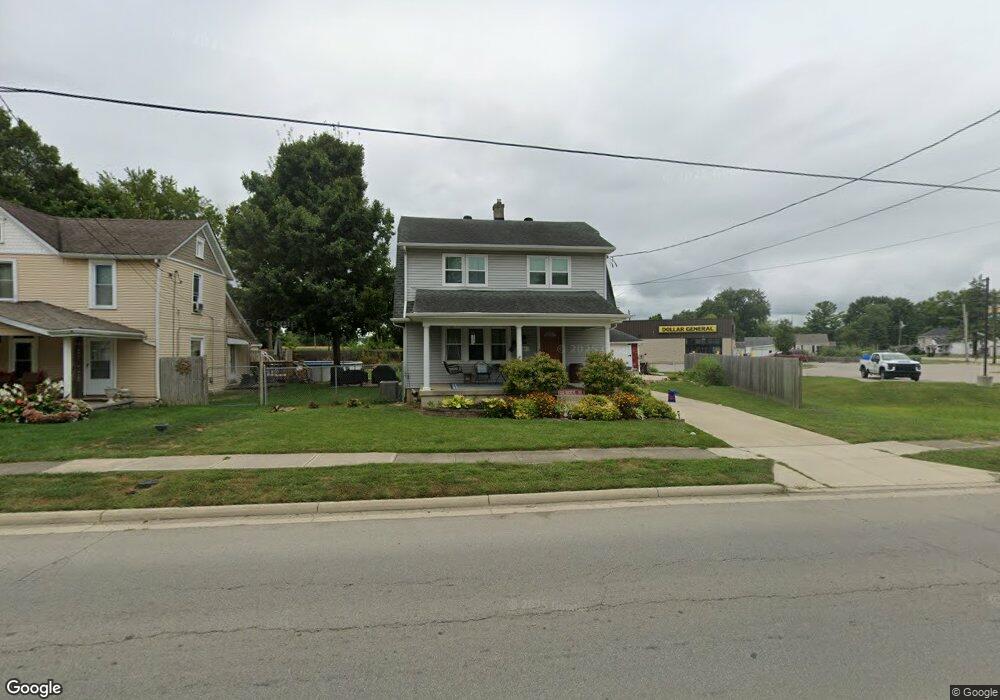
37 S State St Phillipsburg, OH 45354
Estimated Value: $154,000 - $184,498
3
Beds
1
Bath
1,456
Sq Ft
$117/Sq Ft
Est. Value
About This Home
This home is located at 37 S State St, Phillipsburg, OH 45354 and is currently estimated at $170,375, approximately $117 per square foot. 37 S State St is a home located in Montgomery County with nearby schools including Union Elementary School and Northmont High School.
Ownership History
Date
Name
Owned For
Owner Type
Purchase Details
Closed on
Oct 19, 2009
Sold by
Dexter Troy C
Bought by
Loughman Ronald A
Current Estimated Value
Home Financials for this Owner
Home Financials are based on the most recent Mortgage that was taken out on this home.
Original Mortgage
$87,387
Outstanding Balance
$56,335
Interest Rate
5.07%
Mortgage Type
FHA
Estimated Equity
$114,040
Purchase Details
Closed on
Oct 14, 2009
Sold by
Dexter Terry J and Dexter Melinda R
Bought by
Dexter Troy C
Home Financials for this Owner
Home Financials are based on the most recent Mortgage that was taken out on this home.
Original Mortgage
$87,387
Outstanding Balance
$56,335
Interest Rate
5.07%
Mortgage Type
FHA
Estimated Equity
$114,040
Purchase Details
Closed on
Oct 12, 2009
Sold by
Estate Of Jack W Dexter
Bought by
Dexter Terry J and Dexter Jon A
Home Financials for this Owner
Home Financials are based on the most recent Mortgage that was taken out on this home.
Original Mortgage
$87,387
Outstanding Balance
$56,335
Interest Rate
5.07%
Mortgage Type
FHA
Estimated Equity
$114,040
Purchase Details
Closed on
Oct 24, 1997
Sold by
Millikin Judy L
Bought by
Dexter Troy C and Dexter Jack W
Purchase Details
Closed on
Jul 13, 1995
Sold by
Mcclanahan John P and Mcclanahan Judith A
Bought by
Millikin Judy L
Create a Home Valuation Report for This Property
The Home Valuation Report is an in-depth analysis detailing your home's value as well as a comparison with similar homes in the area
Purchase History
| Date | Buyer | Sale Price | Title Company |
|---|---|---|---|
| Loughman Ronald A | $89,000 | Attorney | |
| Dexter Troy C | -- | Attorney | |
| Dexter Terry J | -- | Attorney | |
| Dexter Terry J | -- | Attorney | |
| Dexter Troy C | $89,000 | -- | |
| Millikin Judy L | -- | -- |
Source: Public Records
Mortgage History
| Date | Status | Borrower | Loan Amount |
|---|---|---|---|
| Open | Loughman Ronald A | $87,387 |
Source: Public Records
Tax History
| Year | Tax Paid | Tax Assessment Tax Assessment Total Assessment is a certain percentage of the fair market value that is determined by local assessors to be the total taxable value of land and additions on the property. | Land | Improvement |
|---|---|---|---|---|
| 2025 | $3,850 | $53,140 | $16,030 | $37,110 |
| 2024 | $3,701 | $53,140 | $16,030 | $37,110 |
| 2023 | $3,701 | $53,140 | $16,030 | $37,110 |
| 2022 | $3,510 | $37,690 | $11,370 | $26,320 |
| 2021 | $3,403 | $37,690 | $11,370 | $26,320 |
| 2020 | $3,356 | $37,690 | $11,370 | $26,320 |
| 2019 | $3,658 | $37,610 | $11,370 | $26,240 |
| 2018 | $3,669 | $37,610 | $11,370 | $26,240 |
| 2017 | $3,652 | $37,610 | $11,370 | $26,240 |
| 2016 | $3,494 | $32,860 | $11,370 | $21,490 |
| 2015 | $2,700 | $32,860 | $11,370 | $21,490 |
| 2014 | $2,700 | $32,860 | $11,370 | $21,490 |
| 2012 | -- | $33,470 | $10,260 | $23,210 |
Source: Public Records
Map
Nearby Homes
- 11031 N Montgomery County Line Rd
- 6617 Sweet Potato Ridge Rd
- 8375 N Montgomery County Line Rd
- 8702 S Dayton Greenville Pike
- 8686 National Rd
- Alt State Route 49 Alt 49 State Route 49
- 10983 Haber Rd
- 0 Haber Rd Unit 25497952
- 7415 Pleasant Plain Rd
- 5775 Swan Dr
- 232 Irongate Dr
- 119 Springhouse Dr
- 7827 S Jay Rd
- 131 Springhouse Dr
- 122 Springhouse Dr
- 4407 Sweet Potato Ridge Rd
- 7501 S Brookstone Place
- 10716 Wengerlawn Rd
- 6543 Brookville Salem Rd
- 121 Irongate Dr
Your Personal Tour Guide
Ask me questions while you tour the home.