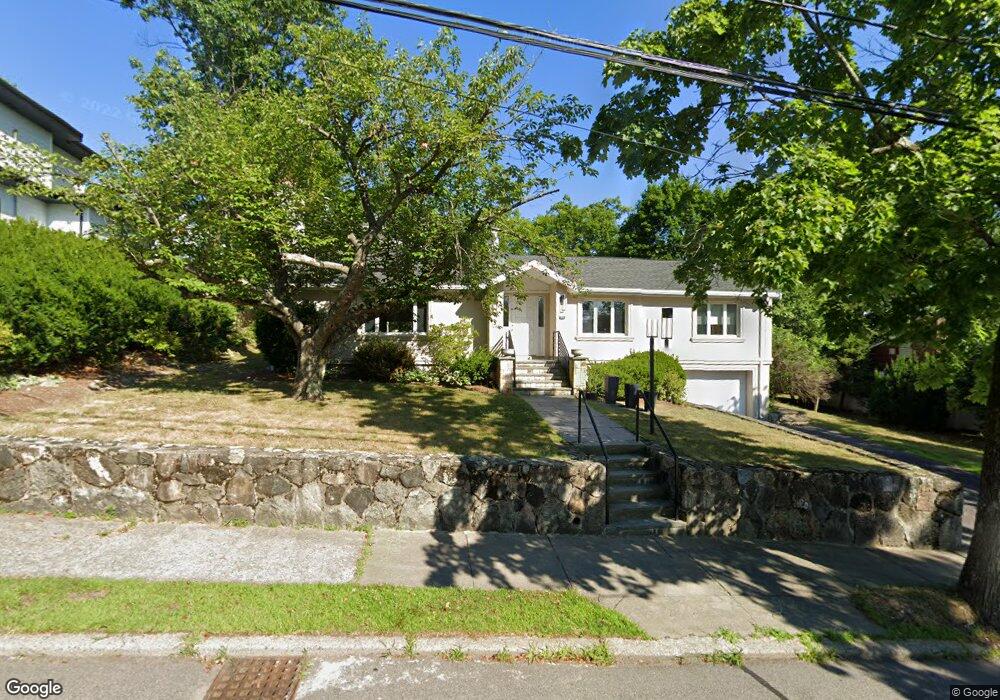
37 Sharpe Rd Newton Center, MA 02459
Oak Hill NeighborhoodEstimated Value: $1,430,000 - $2,195,000
4
Beds
4
Baths
2,290
Sq Ft
$820/Sq Ft
Est. Value
About This Home
This home is located at 37 Sharpe Rd, Newton Center, MA 02459 and is currently estimated at $1,878,473, approximately $820 per square foot. 37 Sharpe Rd is a home located in Middlesex County with nearby schools including Countryside Elementary School, Memorial Spaulding Elementary School, and Charles E Brown Middle School.
Ownership History
Date
Name
Owned For
Owner Type
Purchase Details
Closed on
Jul 30, 1990
Sold by
Est Fields Janet H
Bought by
Alterescu Bruno
Current Estimated Value
Home Financials for this Owner
Home Financials are based on the most recent Mortgage that was taken out on this home.
Original Mortgage
$210,000
Interest Rate
10.01%
Mortgage Type
Purchase Money Mortgage
Create a Home Valuation Report for This Property
The Home Valuation Report is an in-depth analysis detailing your home's value as well as a comparison with similar homes in the area
Home Values in the Area
Average Home Value in this Area
Purchase History
| Date | Buyer | Sale Price | Title Company |
|---|---|---|---|
| Alterescu Bruno | $262,500 | -- |
Source: Public Records
Mortgage History
| Date | Status | Borrower | Loan Amount |
|---|---|---|---|
| Closed | Alterescu Bruno | $202,300 | |
| Closed | Alterescu Bruno | $202,300 | |
| Closed | Alterescu Bruno | $210,000 |
Source: Public Records
Tax History Compared to Growth
Tax History
| Year | Tax Paid | Tax Assessment Tax Assessment Total Assessment is a certain percentage of the fair market value that is determined by local assessors to be the total taxable value of land and additions on the property. | Land | Improvement |
|---|---|---|---|---|
| 2025 | $17,107 | $1,745,600 | $1,088,800 | $656,800 |
| 2024 | $16,541 | $1,694,800 | $1,057,100 | $637,700 |
| 2023 | $15,738 | $1,546,000 | $820,500 | $725,500 |
| 2022 | $15,059 | $1,431,500 | $759,700 | $671,800 |
| 2021 | $14,531 | $1,350,500 | $716,700 | $633,800 |
| 2020 | $14,099 | $1,350,500 | $716,700 | $633,800 |
| 2019 | $14,112 | $1,311,200 | $695,800 | $615,400 |
| 2018 | $13,093 | $1,210,100 | $637,000 | $573,100 |
| 2017 | $12,695 | $1,141,600 | $600,900 | $540,700 |
| 2016 | $12,141 | $1,066,900 | $561,600 | $505,300 |
| 2015 | $11,576 | $997,100 | $524,900 | $472,200 |
Source: Public Records
Map
Nearby Homes
- 58 Country Club Rd
- 415 Dedham St Unit D
- 15 Buff Cir
- 45 Brandeis Rd
- 65 Levbert Rd
- 36 Cannon St
- 250 Woodcliff Rd
- 19 Selwyn Rd
- 35 Haynes Rd
- 41 Juniper Ln
- 135 Hartman Rd
- 59 Deborah Rd
- 56 Cynthia Rd
- 21 Philbrick Rd
- 628 Boylston St
- 207 Nahanton St Unit 207
- 36 Ober Rd
- 125 Oakdale Rd
- 85 Dudley Rd
- 63 Drumlin Rd