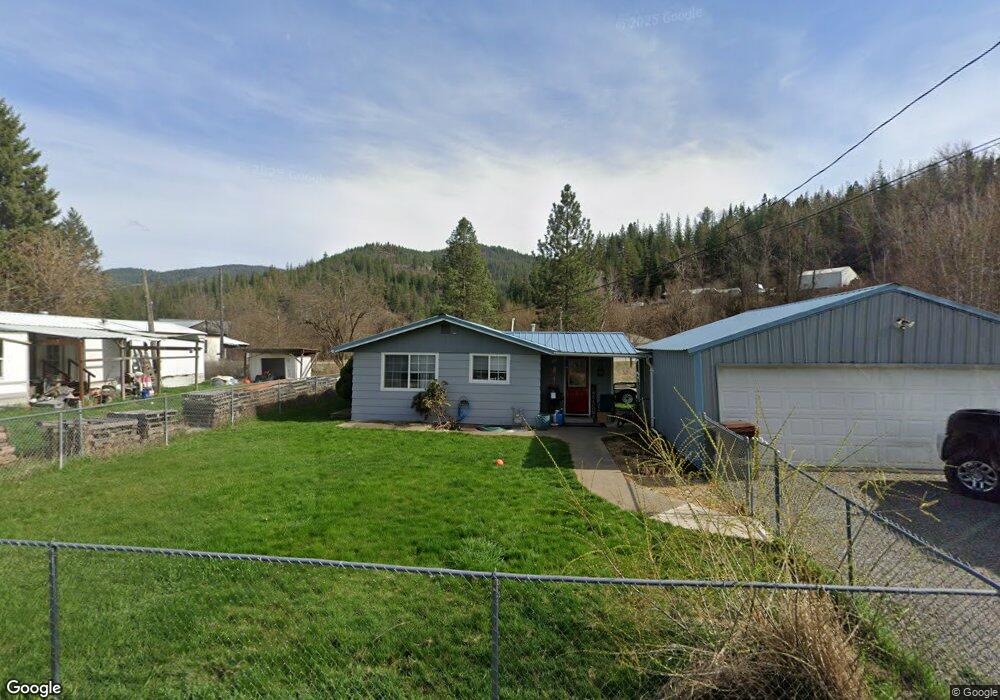
37 Stebbins Rd Pinehurst, ID 83850
Estimated Value: $81,678 - $355,000
2
Beds
1
Bath
728
Sq Ft
$318/Sq Ft
Est. Value
About This Home
This home is located at 37 Stebbins Rd, Pinehurst, ID 83850 and is currently estimated at $231,670, approximately $318 per square foot. 37 Stebbins Rd is a home located in Shoshone County with nearby schools including Pinehurst Elementary School, Kellogg Middle School, and Kellogg High School.
Ownership History
Date
Name
Owned For
Owner Type
Purchase Details
Closed on
Jul 29, 2011
Sold by
Trecker Lynda A
Bought by
Thoren Colleen K
Current Estimated Value
Create a Home Valuation Report for This Property
The Home Valuation Report is an in-depth analysis detailing your home's value as well as a comparison with similar homes in the area
Home Values in the Area
Average Home Value in this Area
Purchase History
| Date | Buyer | Sale Price | Title Company |
|---|---|---|---|
| Thoren Colleen K | -- | -- |
Source: Public Records
Tax History
| Year | Tax Paid | Tax Assessment Tax Assessment Total Assessment is a certain percentage of the fair market value that is determined by local assessors to be the total taxable value of land and additions on the property. | Land | Improvement |
|---|---|---|---|---|
| 2025 | -- | $38,513 | $32,074 | $6,439 |
| 2024 | -- | $38,513 | $32,074 | $6,439 |
| 2023 | $0 | $38,513 | $32,074 | $6,439 |
| 2022 | $0 | $35,500 | $29,395 | $6,105 |
| 2021 | $58 | $26,238 | $22,388 | $3,850 |
| 2020 | $0 | $25,112 | $21,262 | $3,850 |
| 2019 | $0 | $22,859 | $19,009 | $3,850 |
| 2018 | $0 | $17,859 | $14,009 | $3,850 |
| 2017 | $0 | $17,859 | $14,009 | $3,850 |
| 2016 | -- | $17,859 | $14,009 | $3,850 |
| 2015 | -- | $17,859 | $14,009 | $3,850 |
| 2014 | -- | $16,949 | $14,009 | $2,940 |
Source: Public Records
Map
Nearby Homes
- 754 Paradise Ln
- 6 Maple Ave
- 99 Lookout Peak Dr
- 1 Elsie Peak Ct Unit B1, BLDG B
- 502 Wyoming Ave
- 208 S 6th St
- 207 S Division St
- 301 Woodland Dr
- 483 Paradise Ln
- 14 Lilac Ave
- 10 Lewiston Ave
- 202 Country Club Ln
- 140 Wright
- 608 Country Club Ln
- 202 Silver Saddle Ct
- 63 Reinoehl Rd
- 113 Trail Blazer Ct
- 111 Trail Blazer Ct
- 0 Lot J Frosty Ln Unit 25-9282
- 30.91acs French Gulch Rd
- 51 Stebbins Rd
- 0 Stebbins Rd
- 0 Stebbins St
- 50 Grubich Rd
- 14 Stebbins Rd
- 14 Stebbins St
- 75 Stebbins Rd
- 75 Stebbins St
- 48 Stebbins Rd
- 140 Grubich Rd
- 114 Grubich Rd
- 11 Weir Gulch Rd
- 82 Stebbins Rd
- 95 Stebbins Rd
- 128 Grubich Rd
- 370 Weir Gulch Rd
- 554 Weir Gulch Rd
- 48 Matson St
- 443 Weir Gulch Rd
- 31 Matson St