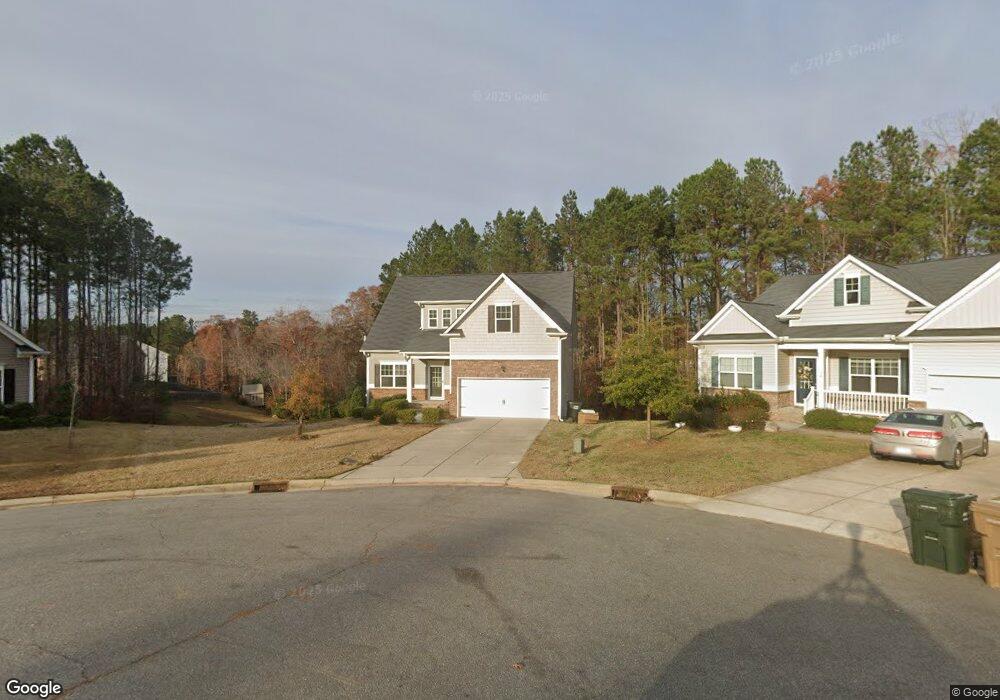
37 Stoneside Cir Unit lot 36 Clayton, NC 27527
Estimated Value: $490,000 - $521,000
3
Beds
3
Baths
2,082
Sq Ft
$244/Sq Ft
Est. Value
About This Home
This home is located at 37 Stoneside Cir Unit lot 36, Clayton, NC 27527 and is currently estimated at $508,716, approximately $244 per square foot. 37 Stoneside Cir Unit lot 36 is a home located in Johnston County with nearby schools including Powhatan Elementary School, Riverwood Middle School, and Clayton High.
Ownership History
Date
Name
Owned For
Owner Type
Purchase Details
Closed on
Oct 16, 2024
Sold by
State Employees Credit Union
Bought by
Secu Re Inc
Current Estimated Value
Purchase Details
Closed on
Jul 29, 2024
Sold by
Glass Philip A
Bought by
State Employees Credit Union
Purchase Details
Closed on
Oct 20, 2022
Sold by
Lowder David Wayne and Lowder Patricia Love
Bought by
Colbert Marcus and Colbert Cicely Shantell
Home Financials for this Owner
Home Financials are based on the most recent Mortgage that was taken out on this home.
Original Mortgage
$492,000
Interest Rate
4.4%
Mortgage Type
New Conventional
Purchase Details
Closed on
Dec 27, 2017
Sold by
Sdh Raleigh Llc
Bought by
Lowder David Wayne and Lowder Patricia Love
Purchase Details
Closed on
Dec 19, 2016
Sold by
Gray Wolf Development Llc
Bought by
Sdh Raleigh Llc
Create a Home Valuation Report for This Property
The Home Valuation Report is an in-depth analysis detailing your home's value as well as a comparison with similar homes in the area
Home Values in the Area
Average Home Value in this Area
Purchase History
| Date | Buyer | Sale Price | Title Company |
|---|---|---|---|
| Secu Re Inc | $394,000 | None Listed On Document | |
| State Employees Credit Union | $509,672 | None Listed On Document | |
| State Employees Credit Union | $509,672 | None Listed On Document | |
| Colbert Marcus | $490,000 | -- | |
| Lowder David Wayne | $260,000 | None Available | |
| Sdh Raleigh Llc | $47,000 | None Available |
Source: Public Records
Mortgage History
| Date | Status | Borrower | Loan Amount |
|---|---|---|---|
| Previous Owner | Colbert Marcus | $492,000 |
Source: Public Records
Tax History Compared to Growth
Tax History
| Year | Tax Paid | Tax Assessment Tax Assessment Total Assessment is a certain percentage of the fair market value that is determined by local assessors to be the total taxable value of land and additions on the property. | Land | Improvement |
|---|---|---|---|---|
| 2025 | $3,139 | $494,310 | $65,000 | $429,310 |
| 2024 | $2,656 | $327,930 | $45,000 | $282,930 |
| 2023 | $2,525 | $327,930 | $45,000 | $282,930 |
| 2022 | $2,591 | $327,930 | $45,000 | $282,930 |
| 2021 | $2,591 | $327,930 | $45,000 | $282,930 |
| 2020 | $2,230 | $271,930 | $45,000 | $226,930 |
| 2019 | $2,193 | $267,430 | $45,000 | $222,430 |
| 2018 | $1,934 | $230,280 | $40,000 | $190,280 |
| 2017 | $336 | $40,000 | $40,000 | $0 |
Source: Public Records
Map
Nearby Homes
- 138 Claymore Dr
- 30 Neuse Hollow Ct
- 66 Neuse Hollow Ct
- 102 Neuse Hollow Ct
- 49 Neuse Hollow Ct
- 90 Neuse Hollow Ct
- 371 Neuse Hollow Ct
- 18 Neuse Hollow Ct
- 119 Neuse Hollow Ct
- 86 Sharpstone Ln
- 387 Cascade Knoll Dr
- Blanco Plan at Neuse Ridge
- Palmer Plan at Neuse Ridge
- Durham Plan at Neuse Ridge
- Carolina Plan at Neuse Ridge
- Allatoona Plan at Neuse Ridge
- Rolen Plan at Neuse Ridge
- Burton Plan at Neuse Ridge
- Dagny Plan at Medley Park
- Drew Plan at Medley Park
- 37 Stoneside Cir
- 38 Stoneside Cir
- 38 Stoneside Cir Unit lot 37
- 29 Stoneside Cir
- 28 Stoneside Cir Unit 38
- 28 Stoneside Cir
- 82 Forest Glade Ct Unit 47
- 82 Forest Glade Ct
- 15 Stoneside Cir
- 15 Stoneside Cir Unit Lot 34
- 74 Forest Glade Ct Unit 48
- 14 Stoneside Cir Unit 39
- 44 Creststone Ct Unit 31
- 44 Creststone Ct
- 28 Creststone Ct Unit 32
- 28 Creststone Ct
- 000 To Be Added Dr Unit lot 48
- 58 Creststone Ct
- 58 Creststone Ct
- 58 Creststone Ct Unit lot 30