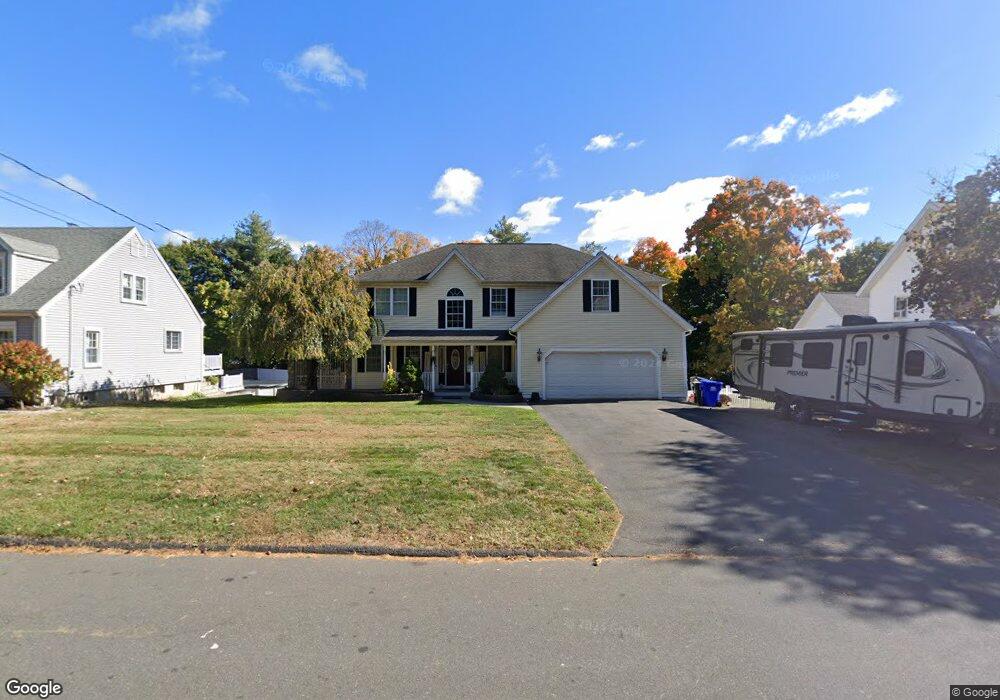
37 Summit St Southington, CT 06489
West Southington NeighborhoodEstimated Value: $559,000 - $703,000
4
Beds
3
Baths
2,407
Sq Ft
$264/Sq Ft
Est. Value
About This Home
This home is located at 37 Summit St, Southington, CT 06489 and is currently estimated at $635,881, approximately $264 per square foot. 37 Summit St is a home located in Hartford County with nearby schools including Derynoski Elementary School, John F. Kennedy Middle School, and Southington High School.
Ownership History
Date
Name
Owned For
Owner Type
Purchase Details
Closed on
Oct 25, 2017
Sold by
Osoria Javier
Bought by
Frausto Martin
Current Estimated Value
Purchase Details
Closed on
Nov 3, 2014
Sold by
Brino Claudio
Bought by
Frausto Martin and Osoria Javier
Purchase Details
Closed on
May 22, 1996
Sold by
Hamilton Shannon and Hamilton Glenn
Bought by
Rembish Thomas
Create a Home Valuation Report for This Property
The Home Valuation Report is an in-depth analysis detailing your home's value as well as a comparison with similar homes in the area
Home Values in the Area
Average Home Value in this Area
Purchase History
| Date | Buyer | Sale Price | Title Company |
|---|---|---|---|
| Frausto Martin | -- | -- | |
| Frausto Martin | $380,000 | -- | |
| Rembish Thomas | $60,000 | -- |
Source: Public Records
Mortgage History
| Date | Status | Borrower | Loan Amount |
|---|---|---|---|
| Previous Owner | Rembish Thomas | $173,776 | |
| Previous Owner | Rembish Thomas | $200,000 | |
| Previous Owner | Rembish Thomas | $140,000 | |
| Previous Owner | Rembish Thomas | $170,000 |
Source: Public Records
Tax History Compared to Growth
Tax History
| Year | Tax Paid | Tax Assessment Tax Assessment Total Assessment is a certain percentage of the fair market value that is determined by local assessors to be the total taxable value of land and additions on the property. | Land | Improvement |
|---|---|---|---|---|
| 2025 | $8,123 | $244,580 | $49,580 | $195,000 |
| 2024 | $7,690 | $244,580 | $49,580 | $195,000 |
| 2023 | $7,425 | $244,580 | $49,580 | $195,000 |
| 2022 | $7,125 | $244,580 | $49,580 | $195,000 |
| 2021 | $7,100 | $244,580 | $49,580 | $195,000 |
| 2020 | $6,980 | $227,880 | $50,590 | $177,290 |
| 2019 | $6,982 | $227,880 | $50,590 | $177,290 |
| 2018 | $6,946 | $227,880 | $50,590 | $177,290 |
| 2017 | $6,946 | $227,880 | $50,590 | $177,290 |
| 2016 | $6,754 | $227,880 | $50,590 | $177,290 |
| 2015 | $6,592 | $226,220 | $48,180 | $178,040 |
| 2014 | $6,416 | $226,220 | $48,180 | $178,040 |
Source: Public Records
Map
Nearby Homes