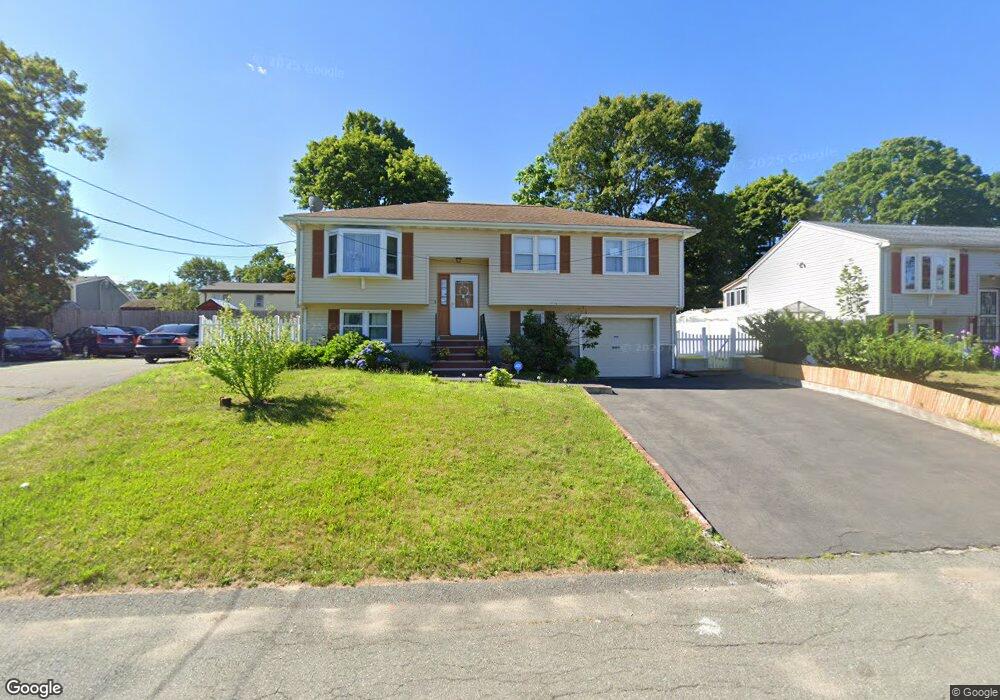
37 Teele St Brockton, MA 02302
Estimated Value: $550,752 - $570,000
3
Beds
2
Baths
1,584
Sq Ft
$355/Sq Ft
Est. Value
About This Home
This home is located at 37 Teele St, Brockton, MA 02302 and is currently estimated at $562,438, approximately $355 per square foot. 37 Teele St is a home located in Plymouth County with nearby schools including Brookfield Elementary School, Mary E. Baker Elementary School, and Downey Elementary School.
Ownership History
Date
Name
Owned For
Owner Type
Purchase Details
Closed on
May 7, 2018
Sold by
Louisne Antonine
Bought by
Louisne Antonine and Louisne Exant
Current Estimated Value
Purchase Details
Closed on
Jan 26, 2004
Sold by
Louisne Exant and Louisne Antonine
Bought by
Louisne Antonine
Purchase Details
Closed on
Apr 1, 1994
Sold by
Foley Theresa R
Bought by
Louisne Exant and Louisne Antonine
Home Financials for this Owner
Home Financials are based on the most recent Mortgage that was taken out on this home.
Original Mortgage
$93,936
Interest Rate
7.07%
Mortgage Type
Purchase Money Mortgage
Create a Home Valuation Report for This Property
The Home Valuation Report is an in-depth analysis detailing your home's value as well as a comparison with similar homes in the area
Home Values in the Area
Average Home Value in this Area
Purchase History
| Date | Buyer | Sale Price | Title Company |
|---|---|---|---|
| Louisne Antonine | -- | -- | |
| Louisne Antonine | -- | -- | |
| Louisne Exant | $96,000 | -- |
Source: Public Records
Mortgage History
| Date | Status | Borrower | Loan Amount |
|---|---|---|---|
| Previous Owner | Louisne Exant | $93,936 | |
| Previous Owner | Louisne Exant | $9,800 | |
| Previous Owner | Louisne Exant | $73,000 |
Source: Public Records
Tax History Compared to Growth
Tax History
| Year | Tax Paid | Tax Assessment Tax Assessment Total Assessment is a certain percentage of the fair market value that is determined by local assessors to be the total taxable value of land and additions on the property. | Land | Improvement |
|---|---|---|---|---|
| 2025 | $6,009 | $496,200 | $137,800 | $358,400 |
| 2024 | $5,897 | $490,600 | $137,800 | $352,800 |
| 2023 | $5,435 | $418,700 | $102,800 | $315,900 |
| 2022 | $4,920 | $352,200 | $93,300 | $258,900 |
| 2021 | $4,744 | $327,200 | $77,300 | $249,900 |
| 2020 | $4,675 | $308,600 | $72,700 | $235,900 |
| 2019 | $4,684 | $301,400 | $70,600 | $230,800 |
| 2018 | $4,312 | $268,500 | $70,600 | $197,900 |
| 2017 | $3,898 | $242,100 | $70,600 | $171,500 |
| 2016 | $4,095 | $235,900 | $68,400 | $167,500 |
| 2015 | $3,817 | $210,300 | $68,400 | $141,900 |
| 2014 | $3,728 | $205,600 | $68,400 | $137,200 |
Source: Public Records
Map
Nearby Homes
- 47 Taber Ave
- 120 E Ashland St
- 12 Charles St
- 0 Prospect St
- 11 Clemens Ave
- 9 Waverly St Unit 2
- 58 Hunt St
- 60 Hunt St
- 560 N Montello St
- 35 Ida Ave
- 39 Huntington St
- 129 Anawan St
- 147 Centre St Unit 603
- 147 Centre St Unit 201
- 39 Mystic St
- 47 Donna St
- 22 Hartley Ave
- 31 Pontiac Rd
- 18 Walnut St
- 59 Merton St