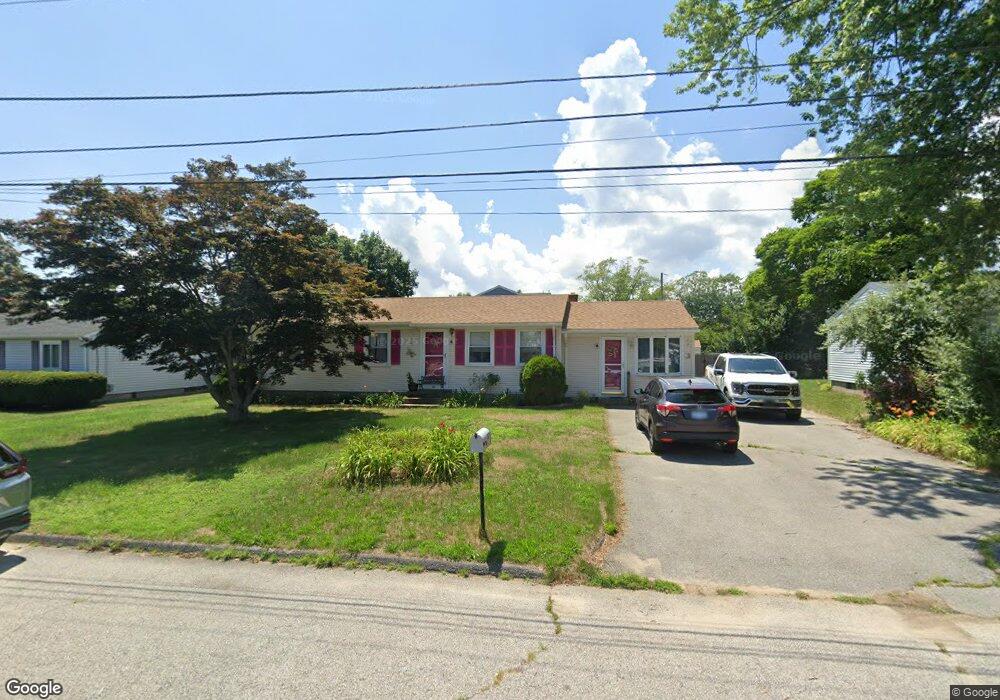
37 Trent Ave Warwick, RI 02889
Wildes Corner NeighborhoodEstimated Value: $409,000 - $419,000
3
Beds
1
Bath
1,314
Sq Ft
$315/Sq Ft
Est. Value
About This Home
This home is located at 37 Trent Ave, Warwick, RI 02889 and is currently estimated at $414,475, approximately $315 per square foot. 37 Trent Ave is a home located in Kent County with nearby schools including Saint Kevin School and St Rose Of Lima School.
Ownership History
Date
Name
Owned For
Owner Type
Purchase Details
Closed on
Apr 22, 2024
Sold by
Tiburcio Lori M
Bought by
Lori M Tiburcio Lt and Tiburcio
Current Estimated Value
Purchase Details
Closed on
Mar 27, 2018
Sold by
Sanita Donald E
Bought by
Tiburcio Lori M
Create a Home Valuation Report for This Property
The Home Valuation Report is an in-depth analysis detailing your home's value as well as a comparison with similar homes in the area
Home Values in the Area
Average Home Value in this Area
Purchase History
| Date | Buyer | Sale Price | Title Company |
|---|---|---|---|
| Lori M Tiburcio Lt | -- | None Available | |
| Lori M Tiburcio Lt | -- | None Available | |
| Tiburcio Lori M | -- | -- | |
| Tiburcio Lori M | -- | -- |
Source: Public Records
Mortgage History
| Date | Status | Borrower | Loan Amount |
|---|---|---|---|
| Previous Owner | Tiburcio Lori M | $40,000 | |
| Previous Owner | Tiburcio Lori M | $10,000 | |
| Previous Owner | Tiburcio Lori M | $40,000 |
Source: Public Records
Tax History
| Year | Tax Paid | Tax Assessment Tax Assessment Total Assessment is a certain percentage of the fair market value that is determined by local assessors to be the total taxable value of land and additions on the property. | Land | Improvement |
|---|---|---|---|---|
| 2025 | $4,869 | $383,400 | $103,400 | $280,000 |
| 2024 | $4,557 | $314,900 | $85,400 | $229,500 |
| 2023 | $4,468 | $314,900 | $85,400 | $229,500 |
| 2022 | $4,121 | $220,000 | $52,600 | $167,400 |
| 2021 | $4,121 | $220,000 | $52,600 | $167,400 |
| 2020 | $4,121 | $220,000 | $52,600 | $167,400 |
| 2019 | $4,121 | $220,000 | $52,600 | $167,400 |
| 2018 | $3,499 | $168,200 | $49,700 | $118,500 |
| 2017 | $3,404 | $168,200 | $49,700 | $118,500 |
| 2016 | $3,404 | $168,200 | $49,700 | $118,500 |
| 2015 | $3,482 | $167,800 | $57,600 | $110,200 |
| 2014 | $3,366 | $167,800 | $57,600 | $110,200 |
| 2013 | $3,321 | $167,800 | $57,600 | $110,200 |
Source: Public Records
Map
Nearby Homes
- 700 Sandy Ln Unit 16
- 700 Sandy Ln Unit 3
- 700 Sandy Ln Unit 5
- 700 Sandy Ln Unit 19
- 700 Sandy Ln Unit 4
- 700 Sandy Ln Unit 20
- 700 Sandy Ln Unit 2
- 207 Stillwater Dr
- 9 Kenneth Ave
- 266 Vineyard Rd
- 195 Oakland Beach Ave
- 112 Old Warwick Ave
- 72 Hollis Ave
- 18 Sevilla Ave
- 211 Pinnery Ave
- 54 Ansonia Rd
- 38 Bowman Dr
- 165 Canfield Ave
- 176 Canfield Ave
- 64 Ormsby Ave
Your Personal Tour Guide
Ask me questions while you tour the home.