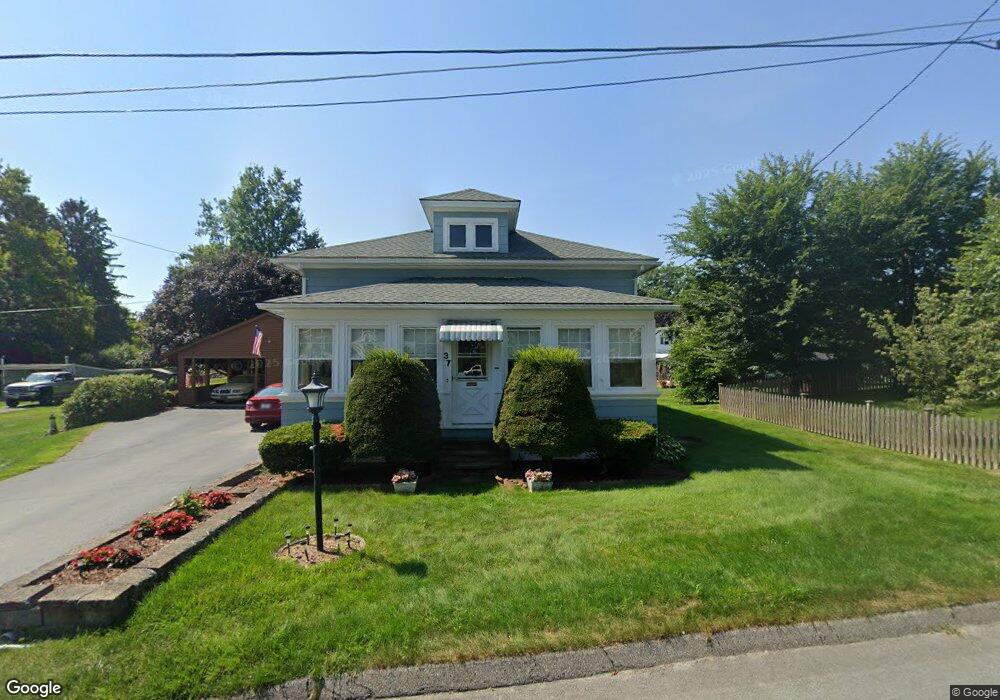
37 View St Pittsfield, MA 01201
Estimated Value: $246,000 - $269,000
3
Beds
1
Bath
1,414
Sq Ft
$182/Sq Ft
Est. Value
About This Home
This home is located at 37 View St, Pittsfield, MA 01201 and is currently estimated at $257,850, approximately $182 per square foot. 37 View St is a home located in Berkshire County with nearby schools including Silvio O. Conte Community School, John T. Reid Middle School, and Taconic High School.
Ownership History
Date
Name
Owned For
Owner Type
Purchase Details
Closed on
Apr 3, 2024
Sold by
Adler Ronald E and Adler Dolores H
Bought by
Adler Ronald E and Adler Dolores H
Current Estimated Value
Purchase Details
Closed on
Jul 23, 2015
Sold by
Adler Ronald E and Adler Dolores H
Bought by
Adler Dennis P and Adler Karen R
Purchase Details
Closed on
Sep 9, 2013
Sold by
Adler Ronald E and Adler Dolores H
Bought by
Adler Dennis P and Adler Karen R
Create a Home Valuation Report for This Property
The Home Valuation Report is an in-depth analysis detailing your home's value as well as a comparison with similar homes in the area
Home Values in the Area
Average Home Value in this Area
Purchase History
| Date | Buyer | Sale Price | Title Company |
|---|---|---|---|
| Adler Ronald E | -- | None Available | |
| Adler Ronald E | -- | None Available | |
| Adler Dennis P | -- | -- | |
| Adler Dennis P | -- | -- | |
| Adler Dennis P | -- | -- | |
| Adler Dennis P | -- | -- |
Source: Public Records
Mortgage History
| Date | Status | Borrower | Loan Amount |
|---|---|---|---|
| Previous Owner | Adler Dennis P | $35,000 |
Source: Public Records
Tax History Compared to Growth
Tax History
| Year | Tax Paid | Tax Assessment Tax Assessment Total Assessment is a certain percentage of the fair market value that is determined by local assessors to be the total taxable value of land and additions on the property. | Land | Improvement |
|---|---|---|---|---|
| 2025 | $4,297 | $239,500 | $59,700 | $179,800 |
| 2024 | $3,930 | $213,000 | $59,700 | $153,300 |
| 2023 | $3,600 | $196,500 | $54,200 | $142,300 |
| 2022 | $3,228 | $173,900 | $50,200 | $123,700 |
| 2021 | $2,889 | $150,100 | $50,200 | $99,900 |
| 2020 | $2,793 | $141,700 | $50,200 | $91,500 |
| 2019 | $2,694 | $138,700 | $50,200 | $88,500 |
| 2018 | $2,711 | $135,500 | $50,200 | $85,300 |
| 2017 | $2,636 | $134,300 | $52,200 | $82,100 |
| 2016 | $2,546 | $135,700 | $52,200 | $83,500 |
| 2015 | $2,451 | $135,700 | $52,200 | $83,500 |
Source: Public Records
Map
Nearby Homes