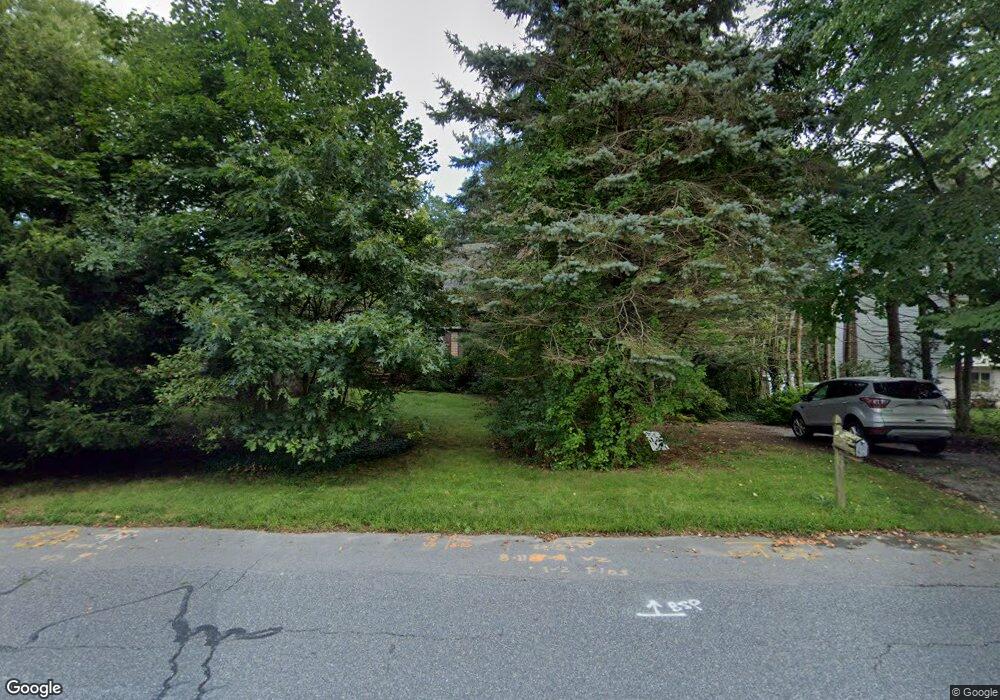
37 Wayside Ln Ashland, MA 01721
Estimated Value: $629,669 - $807,000
3
Beds
3
Baths
1,352
Sq Ft
$527/Sq Ft
Est. Value
About This Home
This home is located at 37 Wayside Ln, Ashland, MA 01721 and is currently estimated at $712,917, approximately $527 per square foot. 37 Wayside Ln is a home located in Middlesex County with nearby schools including William Pittaway Elementary School, Henry E. Warren Elementary School, and David Mindess Elementary School.
Ownership History
Date
Name
Owned For
Owner Type
Purchase Details
Closed on
Nov 19, 1996
Sold by
Papayannopoulos I and Papayannopoulos J C
Bought by
Wallace Robert M
Current Estimated Value
Home Financials for this Owner
Home Financials are based on the most recent Mortgage that was taken out on this home.
Original Mortgage
$172,400
Interest Rate
7.99%
Mortgage Type
Purchase Money Mortgage
Purchase Details
Closed on
Mar 26, 1992
Sold by
Sauve Jack R and Sauve Joyce T
Bought by
Papayannopoulos I and Papayannopoulos C
Home Financials for this Owner
Home Financials are based on the most recent Mortgage that was taken out on this home.
Original Mortgage
$143,000
Interest Rate
8.66%
Mortgage Type
Purchase Money Mortgage
Purchase Details
Closed on
Jan 6, 1989
Sold by
Merriman James J
Bought by
Sauve Jack R
Create a Home Valuation Report for This Property
The Home Valuation Report is an in-depth analysis detailing your home's value as well as a comparison with similar homes in the area
Home Values in the Area
Average Home Value in this Area
Purchase History
| Date | Buyer | Sale Price | Title Company |
|---|---|---|---|
| Wallace Robert M | $181,500 | -- | |
| Papayannopoulos I | $173,000 | -- | |
| Sauve Jack R | $198,000 | -- |
Source: Public Records
Mortgage History
| Date | Status | Borrower | Loan Amount |
|---|---|---|---|
| Open | Sauve Jack R | $153,794 | |
| Closed | Sauve Jack R | $173,500 | |
| Closed | Sauve Jack R | $172,400 | |
| Previous Owner | Sauve Jack R | $143,000 |
Source: Public Records
Tax History
| Year | Tax Paid | Tax Assessment Tax Assessment Total Assessment is a certain percentage of the fair market value that is determined by local assessors to be the total taxable value of land and additions on the property. | Land | Improvement |
|---|---|---|---|---|
| 2025 | $7,399 | $579,400 | $266,200 | $313,200 |
| 2024 | $7,290 | $550,600 | $266,200 | $284,400 |
| 2023 | $6,798 | $493,700 | $253,700 | $240,000 |
| 2022 | $6,833 | $430,300 | $230,800 | $199,500 |
| 2021 | $7,294 | $405,100 | $230,800 | $174,300 |
| 2020 | $6,275 | $388,300 | $234,500 | $153,800 |
| 2019 | $6,084 | $373,700 | $234,500 | $139,200 |
| 2018 | $6,715 | $358,900 | $232,500 | $126,400 |
| 2017 | $6,432 | $351,500 | $233,600 | $117,900 |
| 2016 | $5,731 | $337,100 | $230,800 | $106,300 |
| 2015 | $5,591 | $323,200 | $219,500 | $103,700 |
| 2014 | $5,403 | $310,700 | $202,400 | $108,300 |
Source: Public Records
Map
Nearby Homes
- 72 Fruit St
- 207 Eliot St
- 102 Captain Eames Cir
- 262 Captain Eames Cir
- 153 America Blvd Unit 153
- 125 America Blvd
- 4 John Hancock Dr Unit 4
- 54 Mountain Gate Rd
- 2 Arrowhead Cir Unit 2
- 111 Leland Farm Rd
- 196 Algonquin Trail Unit 196
- 437 America Blvd Unit 437
- 431 America Blvd Unit 431
- 73 Half Crown Cir
- 37 James Rd
- 73 Trailside Way
- 86 E Bluff Rd
- 89 Trailside Way
- 276 Trailside Way Unit 276
- 20 Mulhall Dr
- 39 Wayside Ln
- 35 Wayside Ln
- 41 Wayside Ln
- 29 Wayside Ln
- 29 Wayside Ln
- 29 Wayside Ln Unit 29
- 38 Wayside Ln
- 1 Old Country Path
- 25 Wayside Ln
- 2 Old Country Path
- 3 Old Country Path
- 21 Wayside Ln
- 26 Wayside Ln
- 42 Davis Farm Rd
- 38 Davis Farm Rd
- 6 Bay Colony Dr
- 2 Liberty Hill Cir
- 10 Bay Colony Dr
- 34 Davis Farm Rd
- 2 Bay Colony Dr
Your Personal Tour Guide
Ask me questions while you tour the home.