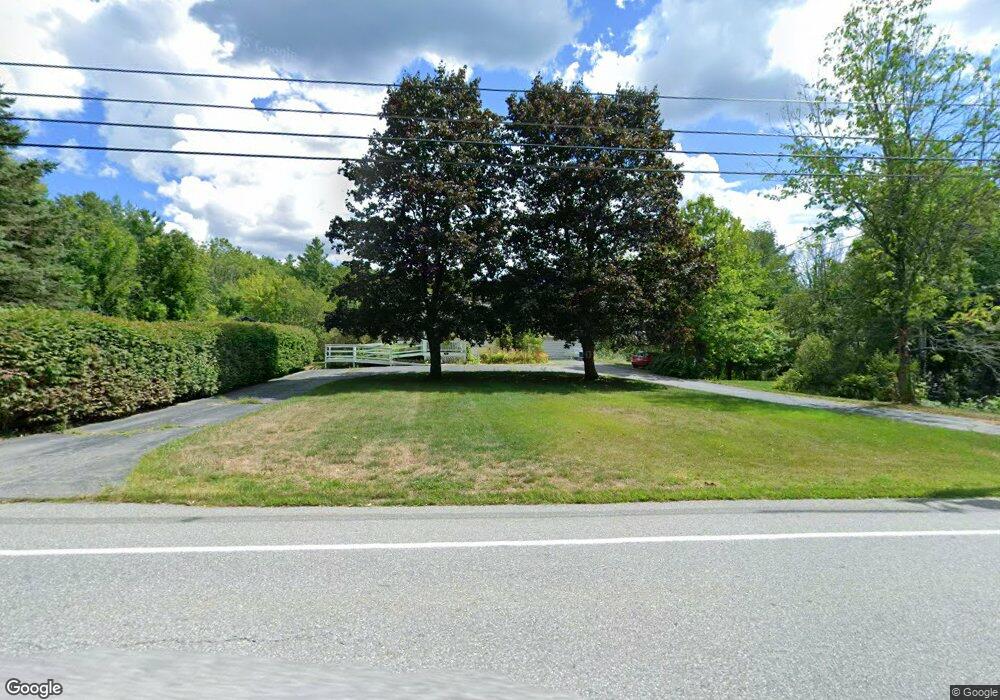
37 Williams Rd Ashburnham, MA 01430
Estimated Value: $376,957 - $463,000
4
Beds
1
Bath
1,672
Sq Ft
$252/Sq Ft
Est. Value
About This Home
This home is located at 37 Williams Rd, Ashburnham, MA 01430 and is currently estimated at $420,739, approximately $251 per square foot. 37 Williams Rd is a home located in Worcester County with nearby schools including Oakmont Regional High School and Cushing Academy.
Ownership History
Date
Name
Owned For
Owner Type
Purchase Details
Closed on
Jan 16, 2008
Sold by
Wehmeyer William C and Wehmeyer Debra A
Bought by
Trafton Margaret V and Wehmeyer Debra
Current Estimated Value
Home Financials for this Owner
Home Financials are based on the most recent Mortgage that was taken out on this home.
Original Mortgage
$224,000
Outstanding Balance
$136,459
Interest Rate
6.02%
Mortgage Type
Purchase Money Mortgage
Estimated Equity
$284,280
Purchase Details
Closed on
Dec 7, 2007
Sold by
Wehmeyer William C
Bought by
Wehmeyer William C and Wehmeyer Debra A
Home Financials for this Owner
Home Financials are based on the most recent Mortgage that was taken out on this home.
Original Mortgage
$224,000
Outstanding Balance
$136,459
Interest Rate
6.02%
Mortgage Type
Purchase Money Mortgage
Estimated Equity
$284,280
Create a Home Valuation Report for This Property
The Home Valuation Report is an in-depth analysis detailing your home's value as well as a comparison with similar homes in the area
Home Values in the Area
Average Home Value in this Area
Purchase History
We collect this data history from publicly available records. To have your information removed, we recommend requesting removal directly through your county’s website.
| Date | Buyer | Sale Price | Title Company |
|---|---|---|---|
| Trafton Margaret V | -- | -- | |
| Trafton Margaret V | -- | -- | |
| Trafton Margaret V | -- | -- | |
| Wehmeyer William C | -- | -- | |
| Wehmeyer William C | -- | -- |
Source: Public Records
Mortgage History
We collect this data history from publicly available records. To have your information removed, we recommend requesting removal directly through your county’s website.
| Date | Status | Borrower | Loan Amount |
|---|---|---|---|
| Open | Trafton Margaret V | $224,000 | |
| Closed | Wehmeyer William C | $224,000 | |
| Previous Owner | Wehmeyer William C | $15,000 |
Source: Public Records
Tax History
| Year | Tax Paid | Tax Assessment Tax Assessment Total Assessment is a certain percentage of the fair market value that is determined by local assessors to be the total taxable value of land and additions on the property. | Land | Improvement |
|---|---|---|---|---|
| 2025 | $4,336 | $291,600 | $100,800 | $190,800 |
| 2024 | $4,221 | $268,000 | $95,700 | $172,300 |
| 2023 | $4,194 | $253,400 | $95,700 | $157,700 |
| 2022 | $4,282 | $226,800 | $81,900 | $144,900 |
| 2021 | $0 | $206,300 | $81,900 | $124,400 |
| 2020 | $4,147 | $206,300 | $81,900 | $124,400 |
| 2019 | $2,940 | $180,800 | $81,900 | $98,900 |
| 2018 | $12,073 | $165,900 | $76,400 | $89,500 |
| 2017 | $3,632 | $158,100 | $71,400 | $86,700 |
| 2016 | $3,770 | $165,700 | $70,800 | $94,900 |
| 2015 | $3,692 | $165,700 | $70,800 | $94,900 |
Source: Public Records
Map
Nearby Homes
- 101 Williams Rd
- 130 Center St
- 40 Corey Hill Rd
- 75 Willard Rd
- 5 Russell Ave
- 18 Fairview Ave
- 9 Willard Rd
- 17 Fairview Ave
- 14 Central St
- 100 Main St
- 46 Fitchburg Rd
- 15 Kirali Ct
- 149 Bragg Hill Rd
- 63 Murray Rd
- 57 Ashby Rd
- Lot 6 Suffolk Ln
- Lot 5 Suffolk Ln
- Lot 40C Winchendon Rd
- 189 Fitchburg Rd
- 159 Ashby Rd
Your Personal Tour Guide
Ask me questions while you tour the home.