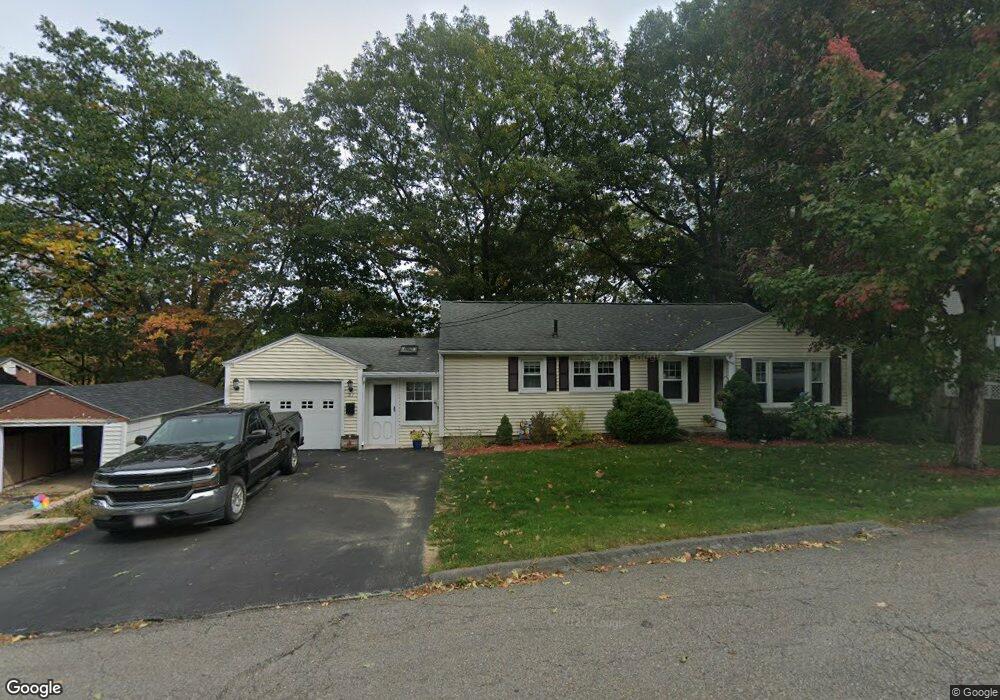
37 Winslow St Gardner, MA 01440
Estimated Value: $300,000 - $374,000
3
Beds
1
Bath
1,088
Sq Ft
$318/Sq Ft
Est. Value
About This Home
This home is located at 37 Winslow St, Gardner, MA 01440 and is currently estimated at $345,806, approximately $317 per square foot. 37 Winslow St is a home located in Worcester County with nearby schools including Gardner High School, Holy Family Academy, and Wachusett Hills Christian School.
Ownership History
Date
Name
Owned For
Owner Type
Purchase Details
Closed on
Nov 20, 2020
Sold by
Ringuette Louis G and Ringuette Sharon E
Bought by
Ringuette Louis G and Ringuette Sharon E
Current Estimated Value
Purchase Details
Closed on
Jan 10, 2014
Sold by
Ringuette Sharon E and Gulliver Bonnie J
Bought by
Ringuette Sharon E and Ringuette Louis G
Home Financials for this Owner
Home Financials are based on the most recent Mortgage that was taken out on this home.
Original Mortgage
$120,000
Interest Rate
3%
Mortgage Type
Adjustable Rate Mortgage/ARM
Create a Home Valuation Report for This Property
The Home Valuation Report is an in-depth analysis detailing your home's value as well as a comparison with similar homes in the area
Home Values in the Area
Average Home Value in this Area
Purchase History
| Date | Buyer | Sale Price | Title Company |
|---|---|---|---|
| Ringuette Louis G | -- | None Available | |
| Ringuette Sharon E | -- | -- |
Source: Public Records
Mortgage History
| Date | Status | Borrower | Loan Amount |
|---|---|---|---|
| Previous Owner | Ringuette Sharon E | $120,000 | |
| Previous Owner | Ringuette Sharon E | $40,000 |
Source: Public Records
Tax History
| Year | Tax Paid | Tax Assessment Tax Assessment Total Assessment is a certain percentage of the fair market value that is determined by local assessors to be the total taxable value of land and additions on the property. | Land | Improvement |
|---|---|---|---|---|
| 2025 | $41 | $287,600 | $73,400 | $214,200 |
| 2024 | $4,104 | $273,800 | $66,800 | $207,000 |
| 2023 | $3,812 | $236,300 | $65,800 | $170,500 |
| 2022 | $3,830 | $206,000 | $49,800 | $156,200 |
| 2021 | $3,723 | $185,800 | $43,300 | $142,500 |
| 2020 | $3,559 | $180,300 | $43,300 | $137,000 |
| 2019 | $3,355 | $166,600 | $43,300 | $123,300 |
| 2018 | $3,182 | $157,000 | $43,300 | $113,700 |
| 2017 | $3,107 | $151,700 | $43,300 | $108,400 |
| 2016 | $2,960 | $144,600 | $43,300 | $101,300 |
| 2015 | $2,805 | $140,400 | $43,300 | $97,100 |
| 2014 | $2,729 | $144,600 | $50,300 | $94,300 |
Source: Public Records
Map
Nearby Homes
Your Personal Tour Guide
Ask me questions while you tour the home.