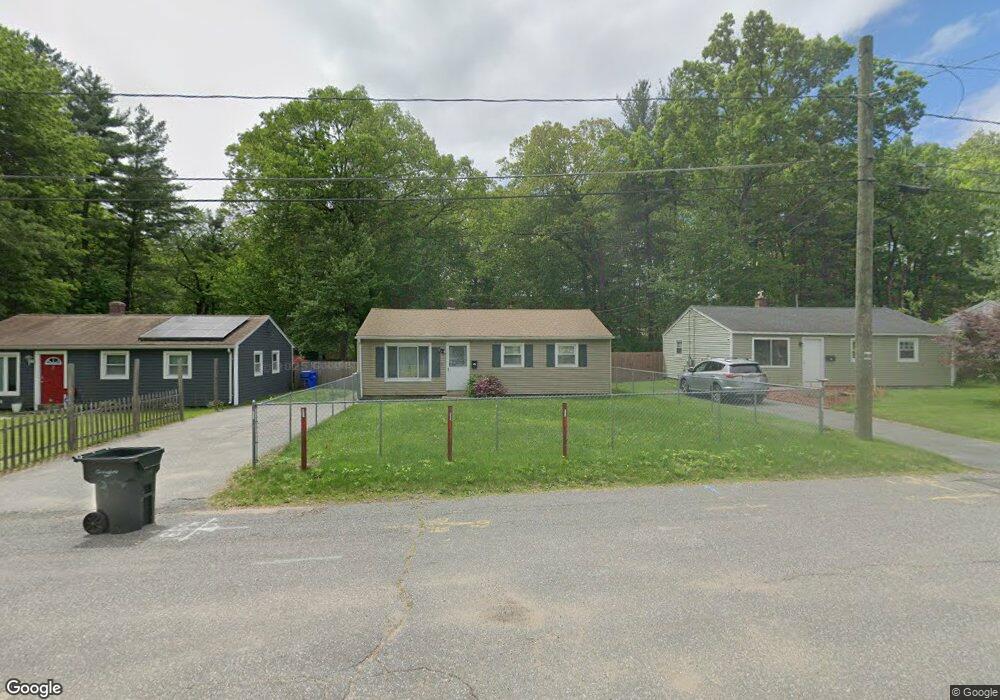
37 Woodcliff St Springfield, MA 01109
Pine Point NeighborhoodEstimated Value: $241,000 - $256,995
3
Beds
1
Bath
925
Sq Ft
$268/Sq Ft
Est. Value
About This Home
This home is located at 37 Woodcliff St, Springfield, MA 01109 and is currently estimated at $247,499, approximately $267 per square foot. 37 Woodcliff St is a home located in Hampden County with nearby schools including Thomas M Balliet Elementary School, John J Duggan Middle, and Roger L. Putnam Vocational Technical Academy.
Ownership History
Date
Name
Owned For
Owner Type
Purchase Details
Closed on
Jan 17, 1997
Sold by
Degray Merlin E and Degray Irene M
Bought by
Matthews Denise R
Current Estimated Value
Home Financials for this Owner
Home Financials are based on the most recent Mortgage that was taken out on this home.
Original Mortgage
$48,400
Outstanding Balance
$5,072
Interest Rate
7.36%
Mortgage Type
Purchase Money Mortgage
Estimated Equity
$242,427
Create a Home Valuation Report for This Property
The Home Valuation Report is an in-depth analysis detailing your home's value as well as a comparison with similar homes in the area
Home Values in the Area
Average Home Value in this Area
Purchase History
| Date | Buyer | Sale Price | Title Company |
|---|---|---|---|
| Matthews Denise R | $51,000 | -- |
Source: Public Records
Mortgage History
| Date | Status | Borrower | Loan Amount |
|---|---|---|---|
| Open | Matthews Denise R | $25,000 | |
| Open | Matthews Denise R | $48,400 | |
| Previous Owner | Matthews Denise R | $54,000 | |
| Previous Owner | Matthews Denise R | $31,400 |
Source: Public Records
Tax History Compared to Growth
Tax History
| Year | Tax Paid | Tax Assessment Tax Assessment Total Assessment is a certain percentage of the fair market value that is determined by local assessors to be the total taxable value of land and additions on the property. | Land | Improvement |
|---|---|---|---|---|
| 2025 | $3,178 | $202,700 | $40,400 | $162,300 |
| 2024 | $3,022 | $188,200 | $33,700 | $154,500 |
| 2023 | $2,286 | $134,100 | $30,600 | $103,500 |
| 2022 | $2,386 | $126,800 | $28,600 | $98,200 |
| 2021 | $2,107 | $111,500 | $26,100 | $85,400 |
| 2020 | $2,140 | $109,600 | $26,100 | $83,500 |
| 2019 | $1,978 | $100,500 | $26,100 | $74,400 |
| 2018 | $1,944 | $98,800 | $26,100 | $72,700 |
| 2017 | $1,970 | $100,200 | $24,100 | $76,100 |
| 2016 | $1,842 | $93,700 | $24,100 | $69,600 |
| 2015 | $1,688 | $85,800 | $24,100 | $61,700 |
Source: Public Records
Map
Nearby Homes