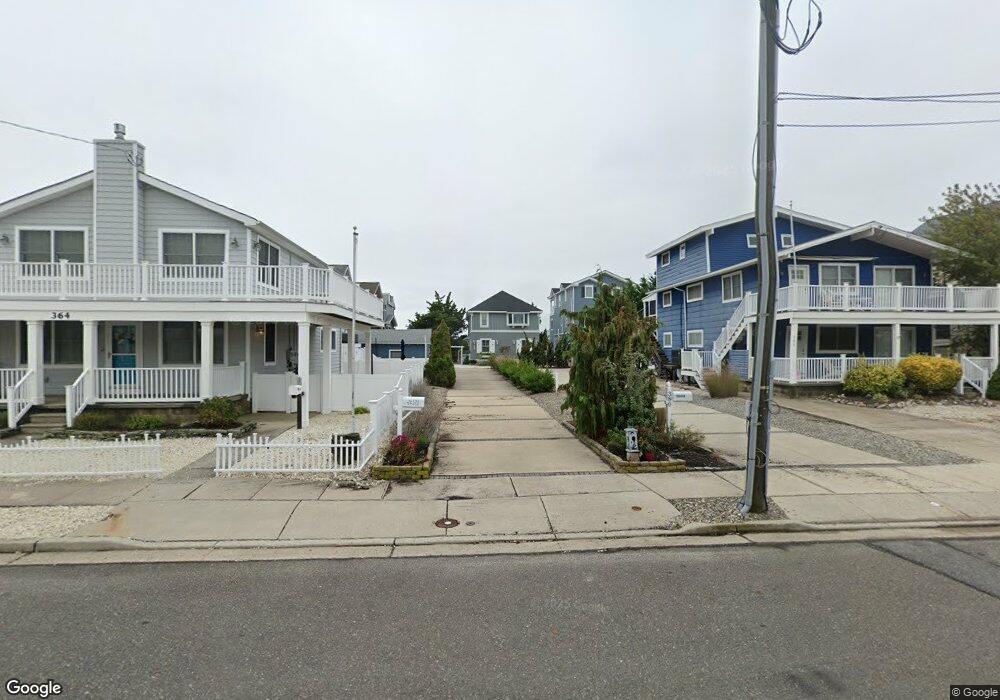
370 24th St Avalon, NJ 08202
Estimated Value: $2,477,745 - $3,199,000
Studio
--
Bath
2,500
Sq Ft
$1,103/Sq Ft
Est. Value
About This Home
This home is located at 370 24th St, Avalon, NJ 08202 and is currently estimated at $2,757,186, approximately $1,102 per square foot. 370 24th St is a home located in Cape May County with nearby schools including Avalon Elementary School.
Ownership History
Date
Name
Owned For
Owner Type
Purchase Details
Closed on
Mar 2, 2011
Sold by
Hagenman Daniel C and Hagenman Lisa A
Bought by
Hayward Jonathan W and Hayward Bette K
Current Estimated Value
Home Financials for this Owner
Home Financials are based on the most recent Mortgage that was taken out on this home.
Original Mortgage
$350,000
Outstanding Balance
$226,819
Interest Rate
3.62%
Mortgage Type
New Conventional
Estimated Equity
$2,530,367
Purchase Details
Closed on
Dec 29, 1993
Sold by
Cape Sav Bk
Bought by
Hagenman Daniel and Hagenman Lisa
Home Financials for this Owner
Home Financials are based on the most recent Mortgage that was taken out on this home.
Original Mortgage
$125,000
Interest Rate
7%
Purchase Details
Closed on
May 3, 1993
Sold by
Plousisjames T Sheriff Co Of C M
Bought by
Cape Savings Bank
Purchase Details
Closed on
Mar 3, 1989
Sold by
Cucinotta Thomas
Bought by
Cucinotta Cheryl
Purchase Details
Closed on
Jul 16, 1988
Sold by
Naughton Harry
Bought by
Diordano Dorothy
Create a Home Valuation Report for This Property
The Home Valuation Report is an in-depth analysis detailing your home's value as well as a comparison with similar homes in the area
Home Values in the Area
Average Home Value in this Area
Purchase History
| Date | Buyer | Sale Price | Title Company |
|---|---|---|---|
| Hayward Jonathan W | $864,500 | Shore Title Agency Inc | |
| Hagenman Daniel | $103,000 | -- | |
| Cape Savings Bank | $100 | -- | |
| Cucinotta Cheryl | -- | -- | |
| Diordano Dorothy | $140,000 | -- |
Source: Public Records
Mortgage History
| Date | Status | Borrower | Loan Amount |
|---|---|---|---|
| Open | Hayward Jonathan W | $350,000 | |
| Previous Owner | Hagenman Daniel | $125,000 |
Source: Public Records
Tax History Compared to Growth
Tax History
| Year | Tax Paid | Tax Assessment Tax Assessment Total Assessment is a certain percentage of the fair market value that is determined by local assessors to be the total taxable value of land and additions on the property. | Land | Improvement |
|---|---|---|---|---|
| 2025 | $5,961 | $970,900 | $484,800 | $486,100 |
| 2024 | $5,961 | $970,900 | $484,800 | $486,100 |
Source: Public Records
Map
Nearby Homes
- 380 24th St
- 2490 Harbor Ave
- 2486 Harbor Ave Unit A
- 2486 Harbor Ave Unit B
- 2456 Harbor Ave
- 2456 Harbor Ave Unit south side
- 386 24th St
- 2454 Harbor Ave
- 2454 Harbor Ave Unit North
- 384 24th St
- 384 24th St Unit 1st Floor
- 388 24th St
- 364 24th St
- 2475 Harbor Ave
- 2491 Harbor Ave
- 2433 Harbor Ave
- 398 24th St
- 398 24th St
- 398 24th St Unit C-W
- 2427 Harbor Ave Unit 2425