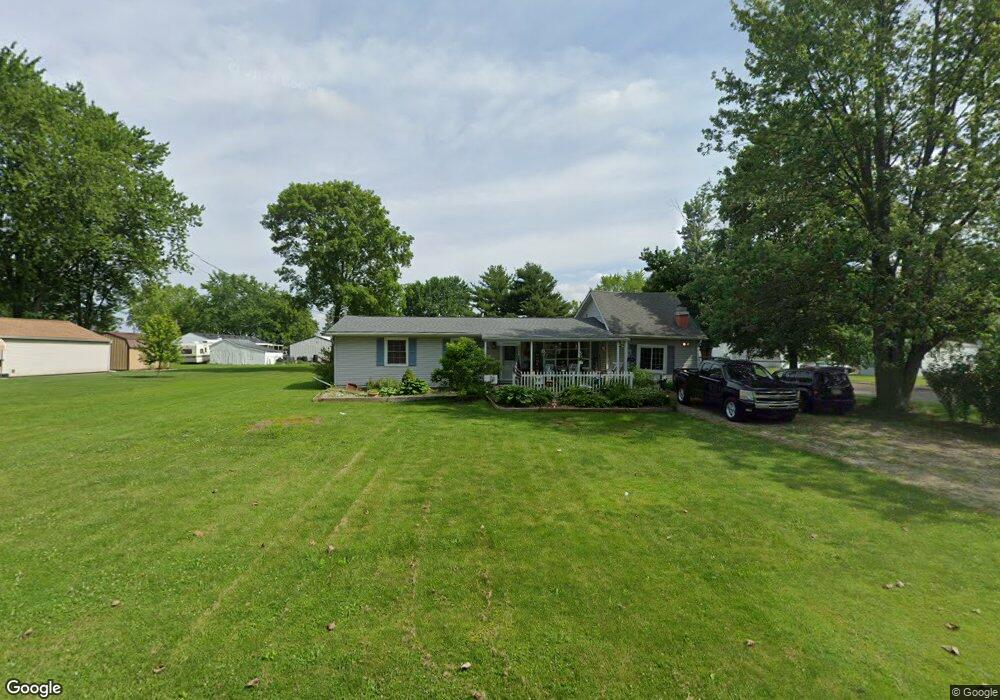
370 5th St Mc Clure, OH 43534
Estimated Value: $136,787 - $192,000
3
Beds
2
Baths
1,392
Sq Ft
$112/Sq Ft
Est. Value
About This Home
This home is located at 370 5th St, Mc Clure, OH 43534 and is currently estimated at $155,447, approximately $111 per square foot. 370 5th St is a home located in Henry County with nearby schools including Napoleon Elementary School and Napoleon Junior/Senior High School.
Ownership History
Date
Name
Owned For
Owner Type
Purchase Details
Closed on
Feb 26, 2010
Sold by
The Huntington National Bank
Bought by
Dazley George and Dazley Marilyn
Current Estimated Value
Purchase Details
Closed on
Dec 31, 2009
Sold by
Buehrer Roger L
Bought by
The Huntington National Bank
Purchase Details
Closed on
Mar 13, 2006
Sold by
Keybank Na
Bought by
Buehrer Roger L
Home Financials for this Owner
Home Financials are based on the most recent Mortgage that was taken out on this home.
Original Mortgage
$23,900
Interest Rate
8.5%
Mortgage Type
Fannie Mae Freddie Mac
Purchase Details
Closed on
Sep 9, 2005
Sold by
Hatcher Jason M and Hatcher Tonia
Bought by
Keybank Na
Purchase Details
Closed on
Jun 18, 1999
Sold by
Mason Sharon
Bought by
Hatcher Jason and Hatcher Tonia
Create a Home Valuation Report for This Property
The Home Valuation Report is an in-depth analysis detailing your home's value as well as a comparison with similar homes in the area
Purchase History
| Date | Buyer | Sale Price | Title Company |
|---|---|---|---|
| Dazley George | $14,500 | Attorney | |
| The Huntington National Bank | $20,000 | Attorney | |
| Buehrer Roger L | $29,900 | Ct | |
| Keybank Na | $45,000 | None Available | |
| Hatcher Jason | $55,000 | -- |
Source: Public Records
Mortgage History
| Date | Status | Borrower | Loan Amount |
|---|---|---|---|
| Previous Owner | Buehrer Roger L | $23,900 | |
| Closed | Hatcher Jason | -- |
Source: Public Records
Tax History
| Year | Tax Paid | Tax Assessment Tax Assessment Total Assessment is a certain percentage of the fair market value that is determined by local assessors to be the total taxable value of land and additions on the property. | Land | Improvement |
|---|---|---|---|---|
| 2024 | $1,545 | $33,780 | $5,550 | $28,230 |
| 2023 | $1,608 | $33,780 | $5,550 | $28,230 |
| 2022 | $1,346 | $48,920 | $7,640 | $41,280 |
| 2021 | $1,346 | $24,460 | $3,820 | $20,640 |
| 2020 | $1,367 | $24,460 | $3,820 | $20,640 |
| 2019 | $1,313 | $22,850 | $3,610 | $19,240 |
| 2018 | $1,320 | $22,850 | $3,610 | $19,240 |
| 2017 | $1,246 | $22,850 | $3,610 | $19,240 |
| 2016 | $1,176 | $20,920 | $3,610 | $17,310 |
| 2015 | $1,159 | $20,920 | $3,610 | $17,310 |
| 2014 | $1,311 | $20,920 | $3,610 | $17,310 |
| 2013 | $1,311 | $23,420 | $3,610 | $19,810 |
Source: Public Records
Map
Nearby Homes
- 520 W North St
- 440 Vine St
- 5451 County Road Q
- S261 County Road 4
- 24432 W 3rd St
- 0 State Route 109
- 17566 Wapakoneta Rd
- 0 County Road K
- 23763 Front St
- 22487 U S 6
- 9173 County Road P3
- 22888 Wintergreen Rd
- 0 Manore Lot A Rd Unit 6130402
- 0 Manore Lot B Rd Unit 6130403
- 12577 S River Rd
- 447 Washington St
- 208 N Henry St
- 665 Ariel Ct
- 9100 Prov Neap Swan Rd
- 0 County Road 424
Your Personal Tour Guide
Ask me questions while you tour the home.