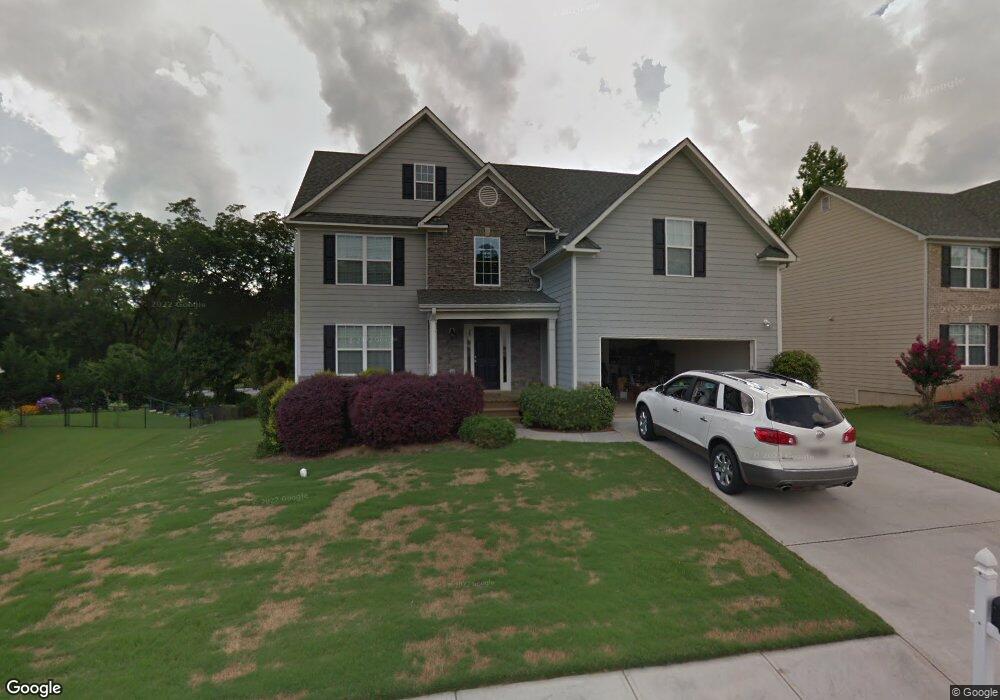
370 Andrew Ridge Dr Unit 7 Jefferson, GA 30549
Estimated Value: $404,000 - $446,000
4
Beds
3
Baths
2,982
Sq Ft
$140/Sq Ft
Est. Value
About This Home
This home is located at 370 Andrew Ridge Dr Unit 7, Jefferson, GA 30549 and is currently estimated at $417,578, approximately $140 per square foot. 370 Andrew Ridge Dr Unit 7 is a home located in Jackson County with nearby schools including Gum Springs Elementary School, West Jackson Middle School, and Jackson County High School.
Ownership History
Date
Name
Owned For
Owner Type
Purchase Details
Closed on
Aug 18, 2017
Sold by
Acton Krista
Bought by
Strickland Patricia and Strickland Melvin
Current Estimated Value
Home Financials for this Owner
Home Financials are based on the most recent Mortgage that was taken out on this home.
Original Mortgage
$180,000
Outstanding Balance
$150,196
Interest Rate
3.96%
Mortgage Type
New Conventional
Estimated Equity
$267,382
Purchase Details
Closed on
Dec 3, 2010
Sold by
Meridian Homes At Millstone Cr
Bought by
Action Krista
Home Financials for this Owner
Home Financials are based on the most recent Mortgage that was taken out on this home.
Original Mortgage
$136,350
Interest Rate
4.62%
Mortgage Type
FHA
Purchase Details
Closed on
Jul 18, 2005
Sold by
Millstone Development Grp
Bought by
Meridian Homes At and Meridian Millstone Cr
Purchase Details
Closed on
May 24, 2005
Sold by
Millstone Development Group Inc
Bought by
Meridian Homes At Millstone Crossing Llc
Create a Home Valuation Report for This Property
The Home Valuation Report is an in-depth analysis detailing your home's value as well as a comparison with similar homes in the area
Home Values in the Area
Average Home Value in this Area
Purchase History
| Date | Buyer | Sale Price | Title Company |
|---|---|---|---|
| Strickland Patricia | $225,000 | -- | |
| Action Krista | $145,500 | -- | |
| Meridian Homes At | $4,045,500 | -- | |
| Meridian Homes At Millstone Crossing Llc | $43,500 | -- |
Source: Public Records
Mortgage History
| Date | Status | Borrower | Loan Amount |
|---|---|---|---|
| Open | Strickland Patricia | $180,000 | |
| Previous Owner | Action Krista | $136,350 |
Source: Public Records
Tax History Compared to Growth
Tax History
| Year | Tax Paid | Tax Assessment Tax Assessment Total Assessment is a certain percentage of the fair market value that is determined by local assessors to be the total taxable value of land and additions on the property. | Land | Improvement |
|---|---|---|---|---|
| 2024 | $4,513 | $171,680 | $24,000 | $147,680 |
| 2023 | $4,483 | $155,640 | $24,000 | $131,640 |
| 2022 | $3,820 | $130,440 | $24,000 | $106,440 |
| 2021 | $3,494 | $118,440 | $12,000 | $106,440 |
| 2020 | $3,221 | $98,040 | $12,000 | $86,040 |
| 2019 | $3,268 | $98,040 | $12,000 | $86,040 |
| 2018 | $3,043 | $93,840 | $12,000 | $81,840 |
| 2017 | $3,006 | $88,139 | $12,000 | $76,139 |
| 2016 | $2,889 | $84,139 | $8,000 | $76,139 |
| 2015 | $2,884 | $84,139 | $8,000 | $76,139 |
| 2014 | $2,128 | $61,353 | $8,000 | $53,353 |
| 2013 | -- | $58,400 | $8,000 | $50,400 |
Source: Public Records
Map
Nearby Homes
- 420 Andrew Ridge Dr
- 104 Jameston Dr
- 581 Rachel View Ct
- 76 Colonial Ct
- 506 Canoe Dr
- 238 Briarcrest Dr
- 245 Briarcrest Dr
- 461 Paxton Ln
- 429 Paxton Ln
- Hayden Plan at Jackson Landing
- Halton Plan at Jackson Landing
- Cali Plan at Jackson Landing
- Denton Plan at Jackson Landing
- Galen Plan at Jackson Landing
- 178 Bullock Pass Unit 5
- 178 Bullock Pass
- 198 Bullock Pass
- 210 Bullock Pass
- 274 Bullock Pass
- 304 Bullock Pass
- 370 Andrew Ridge Dr
- 360 Andrew Ridge Dr
- 380 Andrew Ridge Dr
- 350 Andrew Ridge Dr Unit 5
- 350 Andrew Ridge Dr
- 124 Highway W
- 390 Andrew Ridge Dr
- 371 Andrew Ridge Dr Unit 19
- 371 Andrew Ridge Dr
- 340 Andrew Ridge Dr Unit 4
- 340 Andrew Ridge Dr
- 361 Andrew Ridge Dr
- 401 Andrew Ridge Dr
- 400 Andrew Ridge Dr
- 351 Andrew Ridge Dr
- 330 Andrew Ridge Dr
- 97 Hwy 124w
- 410 Andrew Ridge Dr
- 341 Andrew Ridge Dr
- 411 Andrew Ridge Dr