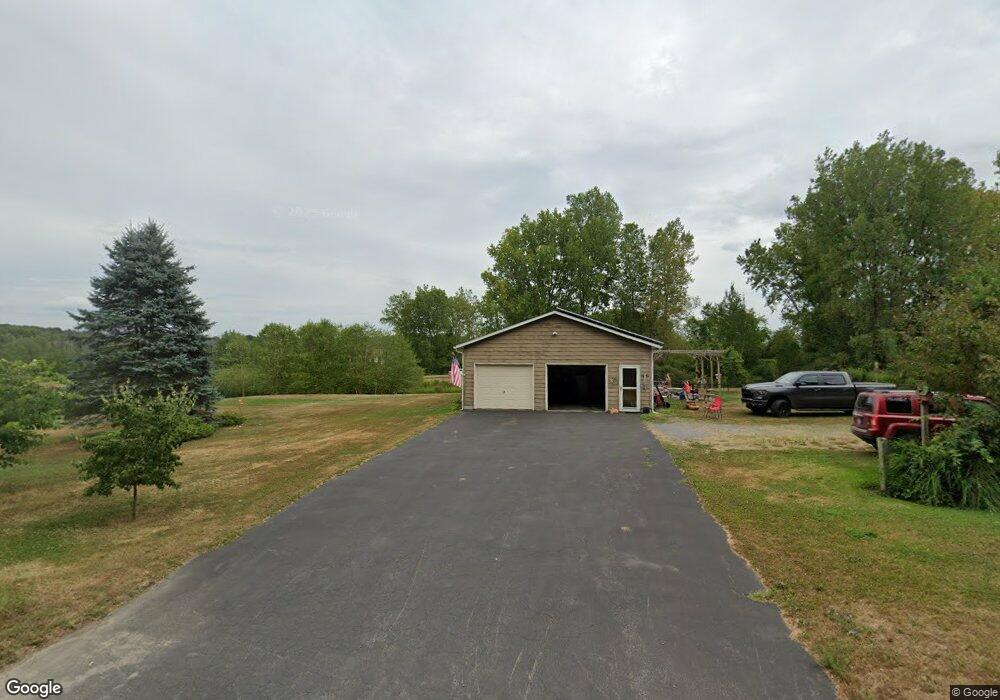
370 Barnard Rd Phoenix, NY 13135
Estimated Value: $232,000 - $255,000
3
Beds
1
Bath
1,162
Sq Ft
$208/Sq Ft
Est. Value
About This Home
This home is located at 370 Barnard Rd, Phoenix, NY 13135 and is currently estimated at $241,236, approximately $207 per square foot. 370 Barnard Rd is a home located in Oswego County with nearby schools including Michael A. Maroun Elementary School, Emerson J Dillon Middle School, and John C Birdlebough High School.
Ownership History
Date
Name
Owned For
Owner Type
Purchase Details
Closed on
Sep 11, 2018
Sold by
Hemler Shirley J and Hemler David A
Bought by
Hemler Shirley J
Current Estimated Value
Purchase Details
Closed on
Sep 26, 2016
Sold by
Jezerski Jeremiah M
Bought by
Hemler Shirley J and Hemler David A
Home Financials for this Owner
Home Financials are based on the most recent Mortgage that was taken out on this home.
Original Mortgage
$96,000
Outstanding Balance
$12,057
Interest Rate
3.43%
Mortgage Type
New Conventional
Estimated Equity
$229,179
Purchase Details
Closed on
Jun 18, 2009
Sold by
Julien Henry B
Bought by
Jezerski Jeremiah M
Home Financials for this Owner
Home Financials are based on the most recent Mortgage that was taken out on this home.
Original Mortgage
$118,808
Interest Rate
4.91%
Mortgage Type
FHA
Purchase Details
Closed on
May 8, 2003
Sold by
Angell David M
Bought by
Julien Henry B
Create a Home Valuation Report for This Property
The Home Valuation Report is an in-depth analysis detailing your home's value as well as a comparison with similar homes in the area
Home Values in the Area
Average Home Value in this Area
Purchase History
| Date | Buyer | Sale Price | Title Company |
|---|---|---|---|
| Hemler Shirley J | -- | None Available | |
| Hemler Shirley J | -- | None Available | |
| Hemler Shirley J | $120,000 | None Available | |
| Jezerski Jeremiah M | $121,000 | None Available | |
| Julien Henry B | $88,000 | -- |
Source: Public Records
Mortgage History
| Date | Status | Borrower | Loan Amount |
|---|---|---|---|
| Open | Hemler Shirley J | $96,000 | |
| Previous Owner | Jezerski Jeremiah M | $118,808 |
Source: Public Records
Tax History
| Year | Tax Paid | Tax Assessment Tax Assessment Total Assessment is a certain percentage of the fair market value that is determined by local assessors to be the total taxable value of land and additions on the property. | Land | Improvement |
|---|---|---|---|---|
| 2024 | $4,779 | $99,500 | $17,900 | $81,600 |
| 2023 | $4,779 | $99,500 | $17,900 | $81,600 |
| 2022 | $5,341 | $99,500 | $17,900 | $81,600 |
| 2021 | $5,299 | $99,500 | $17,900 | $81,600 |
| 2020 | $3,235 | $99,500 | $17,900 | $81,600 |
| 2019 | $5,394 | $99,500 | $17,900 | $81,600 |
| 2018 | $5,394 | $99,500 | $17,900 | $81,600 |
| 2017 | $4,744 | $99,500 | $17,900 | $81,600 |
| 2016 | $4,337 | $99,500 | $17,900 | $81,600 |
| 2015 | -- | $99,500 | $17,900 | $81,600 |
| 2014 | -- | $99,500 | $17,900 | $81,600 |
Source: Public Records
Map
Nearby Homes
- 271 Barnard Rd
- 292-94 Perry Rd Unit 292
- 460 Gilbert Mills Rd
- 0 Gilbert Mills Rd Unit S1670227
- 18 Biddlecum Rd
- 1311 State Route 264
- 814 County Route 6
- 5 Pine Tree Ln
- 42 Island Rd
- 25 Forest Brook Rd
- 0 Emery Rd Unit S1654552
- 383 Peter Scott Rd
- 912 County Route 54
- 19 Gristwood Rd
- 377 Chesbro Rd
- 8835fr Front Gaskin Rd
- LOT 5 Hamilton Way
- LOT 1h Hamilton Way
- 210 Goodfellow Rd Unit 16
- 917 County Route 10
- 279 Biddlecum Rd
- 00 Biddlecum Rd
- 296 Biddlecum Rd
- 356 Barnard Rd
- 507 Barnard Rd
- 355 Barnard Rd
- 266 Biddlecum Rd
- 261 Biddlecum Rd
- 342 Barnard Rd
- 8 Prior Rd
- 345 Biddlecum Rd
- 351 Biddlecum Rd
- 1035 State Route 264
- 93 Prior Rd
- 105 Prior Rd
- 897 State Route 264
- 1071 State Route 264
- 168 Biddlecum Rd
- 1079 State Route 264
- 1074 State Route 264
Your Personal Tour Guide
Ask me questions while you tour the home.