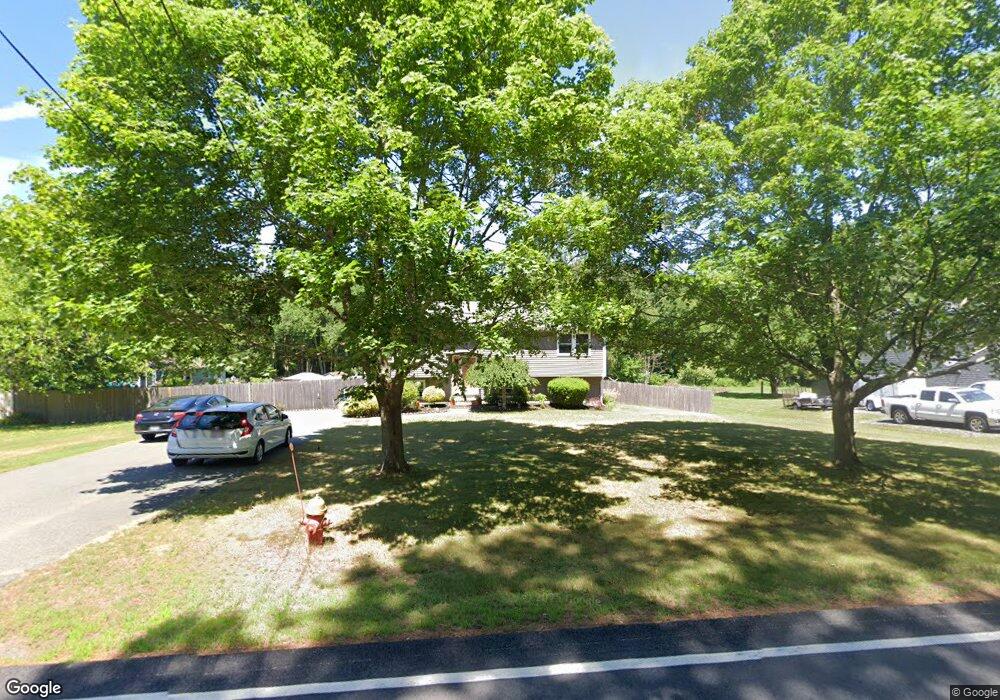
370 Cedar St East Bridgewater, MA 02333
Estimated Value: $484,000 - $594,000
3
Beds
2
Baths
1,080
Sq Ft
$488/Sq Ft
Est. Value
About This Home
This home is located at 370 Cedar St, East Bridgewater, MA 02333 and is currently estimated at $526,554, approximately $487 per square foot. 370 Cedar St is a home located in Plymouth County with nearby schools including Central Elementary School, Gordon W Mitchell Middle School, and East Bridgewater Jr./Sr. High School.
Ownership History
Date
Name
Owned For
Owner Type
Purchase Details
Closed on
Nov 25, 1991
Sold by
Sprunk Richard W and Sprunk Jane E
Bought by
Mateiro Joao H and Mateiro Robin M
Current Estimated Value
Home Financials for this Owner
Home Financials are based on the most recent Mortgage that was taken out on this home.
Original Mortgage
$120,451
Interest Rate
8.7%
Mortgage Type
Purchase Money Mortgage
Create a Home Valuation Report for This Property
The Home Valuation Report is an in-depth analysis detailing your home's value as well as a comparison with similar homes in the area
Home Values in the Area
Average Home Value in this Area
Purchase History
| Date | Buyer | Sale Price | Title Company |
|---|---|---|---|
| Mateiro Joao H | $130,000 | -- |
Source: Public Records
Mortgage History
| Date | Status | Borrower | Loan Amount |
|---|---|---|---|
| Open | Mateiro Joao H | $190,000 | |
| Closed | Mateiro Joao H | $154,700 | |
| Closed | Mateiro Joao H | $120,451 | |
| Previous Owner | Mateiro Joao H | $15,000 |
Source: Public Records
Tax History Compared to Growth
Tax History
| Year | Tax Paid | Tax Assessment Tax Assessment Total Assessment is a certain percentage of the fair market value that is determined by local assessors to be the total taxable value of land and additions on the property. | Land | Improvement |
|---|---|---|---|---|
| 2025 | $5,933 | $434,000 | $191,600 | $242,400 |
| 2024 | $5,777 | $417,400 | $184,200 | $233,200 |
| 2023 | $5,696 | $394,200 | $184,200 | $210,000 |
| 2022 | $5,446 | $349,100 | $167,600 | $181,500 |
| 2021 | $0 | $307,100 | $161,000 | $146,100 |
| 2020 | $5,106 | $295,300 | $154,800 | $140,500 |
| 2019 | $4,482 | $282,000 | $148,000 | $134,000 |
| 2018 | $4,878 | $271,600 | $148,000 | $123,600 |
| 2017 | $50,358 | $258,900 | $141,100 | $117,800 |
| 2016 | $4,593 | $252,900 | $141,100 | $111,800 |
| 2015 | $4,493 | $253,000 | $140,100 | $112,900 |
| 2014 | $4,289 | $246,900 | $137,200 | $109,700 |
Source: Public Records
Map
Nearby Homes
- 1247 Central St
- 170 Elm St
- 9 Daisy Ln
- 5 Della Way
- 844 Washington St
- 936 Central St
- 1 Simmons Place
- 80 Phillips St
- 72 Phillips St
- 182 Crystal Water Dr Unit 182
- 217 Crystal Water Dr
- 28 Brookbend Way E
- 1993 Washington St
- 51 Stonegate Dr
- 71 Stonegate Dr
- 78 Crystal Water Dr
- 22 Hudson St
- 1054 Main St
- 587 Bridge St
- 2045 Washington St