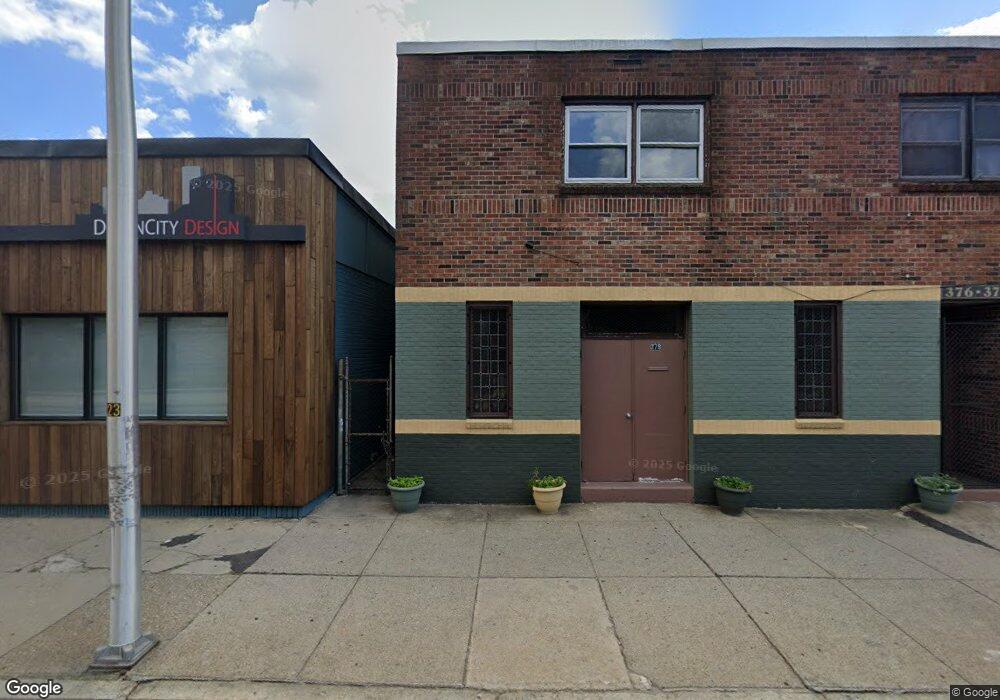
370 Cranston St Providence, RI 02907
West End NeighborhoodEstimated Value: $333,438
Studio
--
Bath
2,886
Sq Ft
$116/Sq Ft
Est. Value
About This Home
This home is located at 370 Cranston St, Providence, RI 02907 and is currently estimated at $333,438, approximately $115 per square foot. 370 Cranston St is a home located in Providence County with nearby schools including William D'abate Elementary School, Roger Williams Middle School, and Nathan Bishop Middle School.
Ownership History
Date
Name
Owned For
Owner Type
Purchase Details
Closed on
Sep 4, 2019
Sold by
Brode Aaron C and Mesa Olga L
Bought by
Downcity Design
Current Estimated Value
Home Financials for this Owner
Home Financials are based on the most recent Mortgage that was taken out on this home.
Original Mortgage
$146,250
Outstanding Balance
$127,251
Interest Rate
3.7%
Mortgage Type
New Conventional
Estimated Equity
$206,187
Purchase Details
Closed on
May 24, 2017
Sold by
R W Properties Llc
Bought by
Brode Aaron C and Mesa Olga L
Home Financials for this Owner
Home Financials are based on the most recent Mortgage that was taken out on this home.
Original Mortgage
$129,000
Interest Rate
4.08%
Mortgage Type
Commercial
Purchase Details
Closed on
Sep 17, 2013
Sold by
370 Cranston St Assoc
Bought by
Rw Properties Llc
Purchase Details
Closed on
Oct 12, 2006
Sold by
370 Cranston Street As
Bought by
Peralta Radhames
Create a Home Valuation Report for This Property
The Home Valuation Report is an in-depth analysis detailing your home's value as well as a comparison with similar homes in the area
Home Values in the Area
Average Home Value in this Area
Purchase History
| Date | Buyer | Sale Price | Title Company |
|---|---|---|---|
| Downcity Design | $195,000 | -- | |
| Downcity Design | $195,000 | -- | |
| Brode Aaron C | $172,000 | -- | |
| Brode Aaron C | $172,000 | -- | |
| Brode Aaron C | $172,000 | -- | |
| Rw Properties Llc | $90,000 | -- | |
| Rw Properties Llc | $90,000 | -- | |
| Peralta Radhames | $50,000 | -- | |
| Peralta Radhames | $50,000 | -- |
Source: Public Records
Mortgage History
| Date | Status | Borrower | Loan Amount |
|---|---|---|---|
| Open | Downcity Design | $146,250 | |
| Closed | Downcity Design | $146,250 | |
| Previous Owner | Brode Aaron C | $129,000 | |
| Previous Owner | Peralta Radhames | $70,000 |
Source: Public Records
Tax History Compared to Growth
Tax History
| Year | Tax Paid | Tax Assessment Tax Assessment Total Assessment is a certain percentage of the fair market value that is determined by local assessors to be the total taxable value of land and additions on the property. | Land | Improvement |
|---|---|---|---|---|
| 2025 | $8,291 | $437,900 | $141,800 | $296,100 |
| 2024 | $8,291 | $236,200 | $85,900 | $150,300 |
| 2023 | $8,291 | $236,200 | $85,900 | $150,300 |
| 2022 | $8,361 | $236,200 | $85,900 | $150,300 |
| 2021 | $6,481 | $176,600 | $68,000 | $108,600 |
| 2020 | $6,481 | $176,600 | $68,000 | $108,600 |
| 2019 | $6,481 | $176,600 | $68,000 | $108,600 |
| 2018 | $6,797 | $185,200 | $68,000 | $117,200 |
| 2017 | $6,797 | $185,200 | $68,000 | $117,200 |
| 2016 | $6,797 | $185,200 | $68,000 | $117,200 |
| 2015 | $6,174 | $168,000 | $64,700 | $103,300 |
| 2014 | $6,174 | $168,000 | $64,700 | $103,300 |
| 2013 | $6,174 | $168,000 | $64,700 | $103,300 |
Source: Public Records
Map
Nearby Homes
- 54 Diamond St
- 43 Chapin Ave Unit 3
- 43 Chapin Ave Unit 2
- 0 Ford St
- 62 Ford St
- 7 Constitution St
- 33 Ford St
- 63 Wood St
- 206 Hanover St
- 55 Warren St
- 71 Wilson St
- 67 Wilson St
- 111 Waverly St
- 139 Messer St
- 30 Rosedale St
- 14 Parade St
- 26 Cromwell St
- 1447 Westminster St Unit 1C
- 70 Rosedale St Unit 1
- 69 Sorrento St Unit 71