370 E 2nd St N Peoria, OK 74363
Estimated Value: $101,917 - $175,000
3
Beds
1
Bath
1,691
Sq Ft
$81/Sq Ft
Est. Value
About This Home
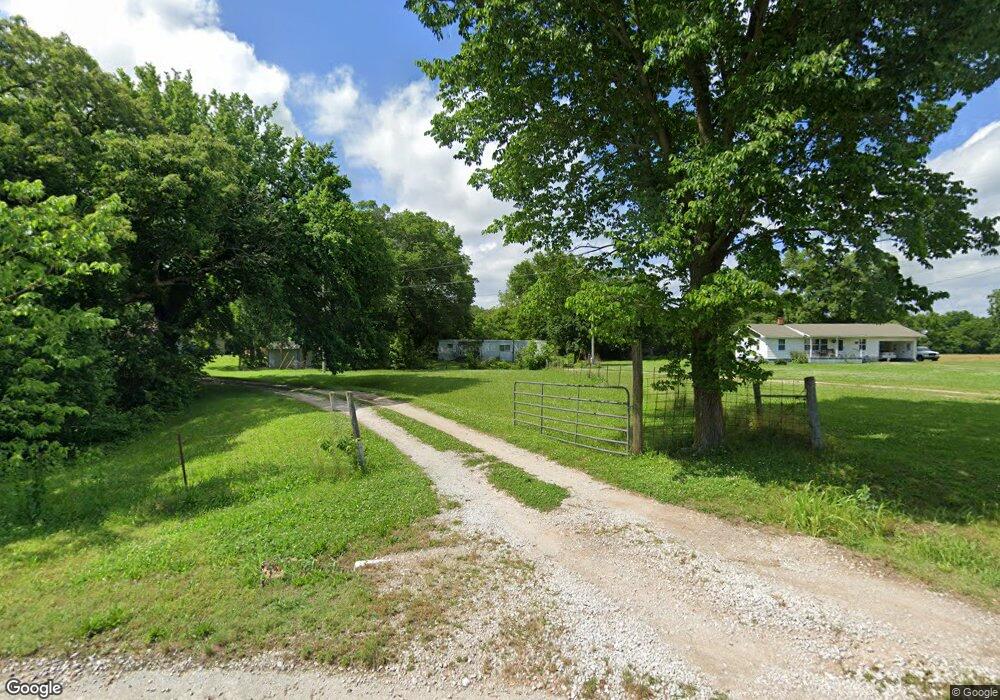
This home is located at 370 E 2nd St N, Peoria, OK 74363 and is currently estimated at $136,479, approximately $80 per square foot. 370 E 2nd St N is a home located in Ottawa County with nearby schools including Quapaw Elementary School, Quapaw Middle School, and Quapaw High School.
Create a Home Valuation Report for This Property
The Home Valuation Report is an in-depth analysis detailing your home's value as well as a comparison with similar homes in the area
Home Values in the Area
Average Home Value in this Area
Tax History Compared to Growth
Tax History
| Year | Tax Paid | Tax Assessment Tax Assessment Total Assessment is a certain percentage of the fair market value that is determined by local assessors to be the total taxable value of land and additions on the property. | Land | Improvement |
|---|---|---|---|---|
| 2024 | $154 | $2,860 | $369 | $2,491 |
| 2023 | $154 | $2,777 | $369 | $2,408 |
| 2022 | $144 | $2,696 | $369 | $2,327 |
| 2021 | $115 | $2,617 | $369 | $2,248 |
| 2020 | $110 | $2,541 | $369 | $2,172 |
| 2019 | $104 | $2,467 | $369 | $2,098 |
| 2018 | $99 | $2,395 | $369 | $2,026 |
| 2017 | $94 | $2,326 | $369 | $1,957 |
| 2016 | $89 | $2,258 | $369 | $1,889 |
| 2015 | $138 | $2,027 | $369 | $1,658 |
| 2014 | $85 | $2,192 | $369 | $1,823 |
Source: Public Records
Map
Nearby Homes
- 66315 E 69 Rd
- 66315 E 69th Rd
- 2301 S 670 Rd
- 67601 E 94 Rd
- 67501 E 94 Rd
- 69897 E 50 Rd
- 2309 S 680 Rd
- 4461 S 650 Rd
- 2036 Kentucky Rd
- 10401 S 670 Rd
- 65133 E 100 Rd
- 2256 Holly Rd
- TBD 660 Rd
- 2305 S 680 Rd
- 7575 &7627 Amarillo Ln
- 7575 and 7627 Amarillo Ln
- 0000 S 637 Rd
- 12609 State Highway 43
- 2648 Gum Rd
- 6741 State Line Rd
- 322 E 2nd St N
- 339 E Main St
- 251 E 1st St N
- 450 E Main St
- 142 E Main St
- 317 E 1st St N
- 43 E 1st St S
- 155 S Kaskaskia St
- 223 E Main St
- 339 E 1st St S
- 6750 S 678 Rd
- 546 E Main St
- 114 S Kaskaskia St
- 222 E Main St
- 139 E Main St
- 118 E 1st St N
- 119 E 1st St N
- 115 S Kaskaskia St
- 242 E 1st St S
- 242 E 1st St S