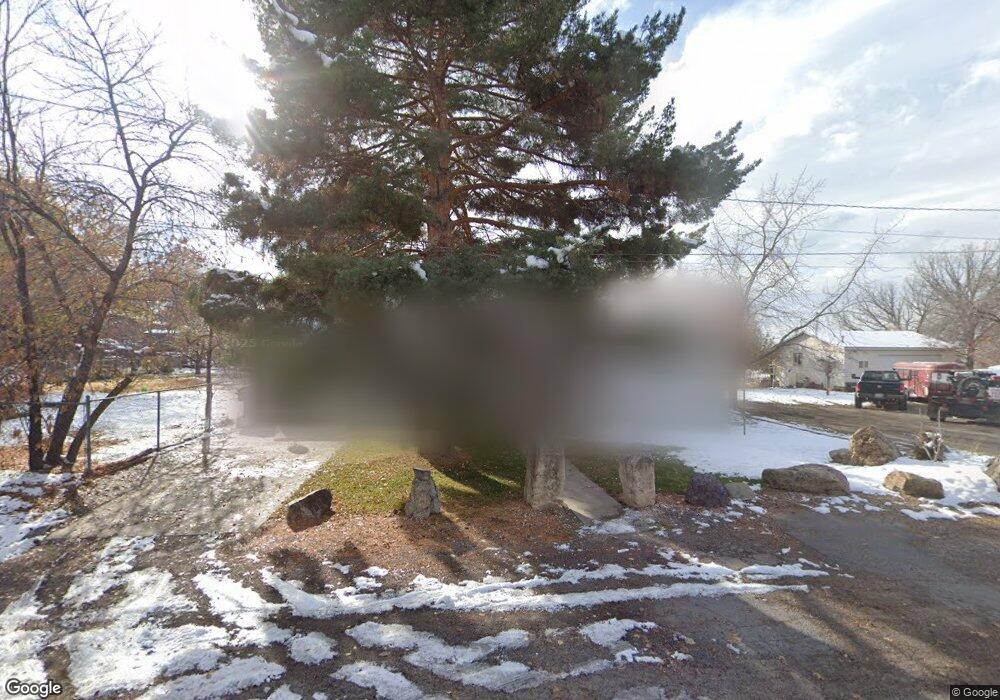
370 E 700 N Pleasant Grove, UT 84062
Estimated Value: $478,000 - $530,809
3
Beds
2
Baths
1,860
Sq Ft
$270/Sq Ft
Est. Value
About This Home
This home is located at 370 E 700 N, Pleasant Grove, UT 84062 and is currently estimated at $501,936, approximately $269 per square foot. 370 E 700 N is a home located in Utah County with nearby schools including Grovecrest Elementary School, Pleasant Grove Junior High School, and Pleasant Grove High School.
Ownership History
Date
Name
Owned For
Owner Type
Purchase Details
Closed on
Apr 13, 2015
Sold by
Nielsen Bradley G and Ormond Shanna L
Bought by
Parry Chase C
Current Estimated Value
Home Financials for this Owner
Home Financials are based on the most recent Mortgage that was taken out on this home.
Original Mortgage
$206,196
Outstanding Balance
$157,336
Interest Rate
3.5%
Mortgage Type
FHA
Estimated Equity
$344,600
Purchase Details
Closed on
Sep 6, 2006
Sold by
Nielsen George L and Nielsen Norman G
Bought by
Nielsen G Lyman and Nielsen Norma G
Create a Home Valuation Report for This Property
The Home Valuation Report is an in-depth analysis detailing your home's value as well as a comparison with similar homes in the area
Home Values in the Area
Average Home Value in this Area
Purchase History
| Date | Buyer | Sale Price | Title Company |
|---|---|---|---|
| Parry Chase C | -- | First American | |
| Nielsen G Lyman | -- | None Available |
Source: Public Records
Mortgage History
| Date | Status | Borrower | Loan Amount |
|---|---|---|---|
| Open | Parry Chase C | $206,196 |
Source: Public Records
Tax History
| Year | Tax Paid | Tax Assessment Tax Assessment Total Assessment is a certain percentage of the fair market value that is determined by local assessors to be the total taxable value of land and additions on the property. | Land | Improvement |
|---|---|---|---|---|
| 2025 | $1,978 | $253,825 | -- | -- |
| 2024 | $1,978 | $230,835 | $0 | $0 |
| 2023 | $1,843 | $225,115 | $0 | $0 |
| 2022 | $1,998 | $242,935 | $0 | $0 |
| 2021 | $1,721 | $318,600 | $176,600 | $142,000 |
| 2020 | $1,581 | $286,800 | $157,700 | $129,100 |
| 2019 | $1,435 | $269,300 | $144,900 | $124,400 |
| 2018 | $1,446 | $256,600 | $132,200 | $124,400 |
| 2017 | $1,369 | $129,360 | $0 | $0 |
| 2016 | $1,256 | $114,510 | $0 | $0 |
| 2015 | $1,237 | $106,810 | $0 | $0 |
| 2014 | $1,232 | $105,380 | $0 | $0 |
Source: Public Records
Map
Nearby Homes
Your Personal Tour Guide
Ask me questions while you tour the home.