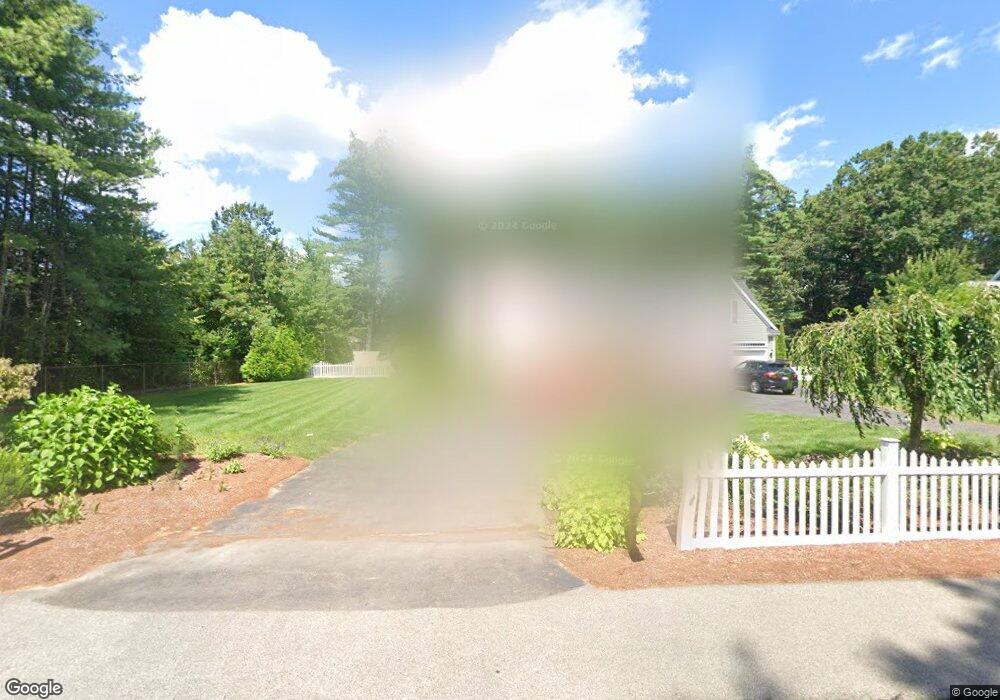
370 Hudson Rd Sudbury, MA 01776
Estimated Value: $1,064,272 - $1,193,000
3
Beds
4
Baths
2,337
Sq Ft
$477/Sq Ft
Est. Value
About This Home
This home is located at 370 Hudson Rd, Sudbury, MA 01776 and is currently estimated at $1,114,068, approximately $476 per square foot. 370 Hudson Rd is a home located in Middlesex County with nearby schools including General John Nixon Elementary School, Ephraim Curtis Middle School, and Lincoln-Sudbury Regional High School.
Ownership History
Date
Name
Owned For
Owner Type
Purchase Details
Closed on
Apr 17, 1997
Sold by
Brooks Andrew S and Brooks Sheila M
Bought by
Lindegren Carl J
Current Estimated Value
Home Financials for this Owner
Home Financials are based on the most recent Mortgage that was taken out on this home.
Original Mortgage
$252,000
Interest Rate
7.76%
Mortgage Type
Purchase Money Mortgage
Purchase Details
Closed on
Mar 27, 1991
Sold by
Tierney Kevin G and Elizabeth Hines C
Bought by
Brooks Andrew S and Connolly Sheila M
Create a Home Valuation Report for This Property
The Home Valuation Report is an in-depth analysis detailing your home's value as well as a comparison with similar homes in the area
Home Values in the Area
Average Home Value in this Area
Purchase History
| Date | Buyer | Sale Price | Title Company |
|---|---|---|---|
| Lindegren Carl J | $315,000 | -- | |
| Brooks Andrew S | $161,000 | -- |
Source: Public Records
Mortgage History
| Date | Status | Borrower | Loan Amount |
|---|---|---|---|
| Open | Brooks Andrew S | $312,000 | |
| Closed | Brooks Andrew S | $252,000 |
Source: Public Records
Tax History Compared to Growth
Tax History
| Year | Tax Paid | Tax Assessment Tax Assessment Total Assessment is a certain percentage of the fair market value that is determined by local assessors to be the total taxable value of land and additions on the property. | Land | Improvement |
|---|---|---|---|---|
| 2025 | $13,703 | $936,000 | $364,400 | $571,600 |
| 2024 | $13,187 | $902,600 | $353,600 | $549,000 |
| 2023 | $12,640 | $801,500 | $339,900 | $461,600 |
| 2022 | $12,510 | $693,100 | $311,900 | $381,200 |
| 2021 | $5,984 | $634,500 | $311,900 | $322,600 |
| 2020 | $11,707 | $634,500 | $311,900 | $322,600 |
| 2019 | $5,329 | $634,500 | $311,900 | $322,600 |
| 2018 | $4,952 | $598,400 | $302,400 | $296,000 |
| 2017 | $10,513 | $592,600 | $299,300 | $293,300 |
| 2016 | $10,201 | $573,100 | $287,800 | $285,300 |
| 2015 | $9,750 | $554,000 | $274,000 | $280,000 |
| 2014 | $9,749 | $540,700 | $266,000 | $274,700 |
Source: Public Records
Map
Nearby Homes
- 47 Fairbank Rd
- 4 Elderberry Cir
- 12 Camperdown Ln
- 36 Old Forge Ln
- 54 Phillips Rd
- 24 Goodnow Rd
- 21 Summer St
- 14 Tanbark Rd
- 55 Widow Rites Ln
- 45 Widow Rites Ln
- 7 Saddle Ridge Rd
- 166 Parker St Unit 4
- 5 Taintor Dr
- 67 Old Marlboro Rd
- 63 Canterbury Dr
- 270 Old Lancaster Rd
- 30 Rolling Ln
- 89 Bridle Path
- 25 Bridle Path
- 143 Peakham Rd