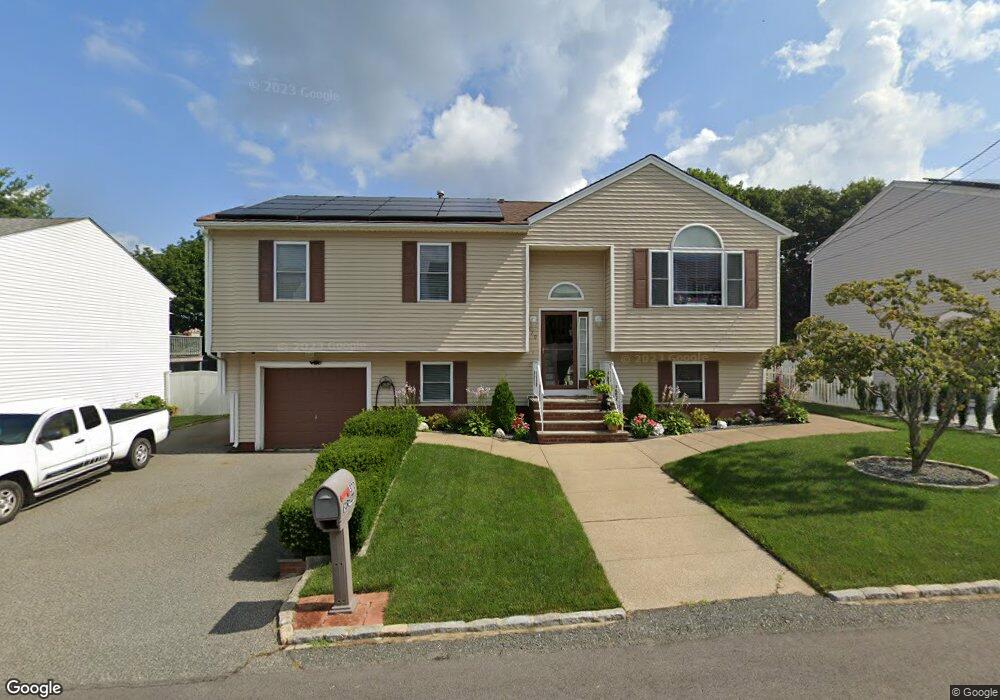
370 Ludlow St Fall River, MA 02721
Maplewood NeighborhoodEstimated Value: $466,000 - $506,000
3
Beds
2
Baths
1,794
Sq Ft
$271/Sq Ft
Est. Value
About This Home
This home is located at 370 Ludlow St, Fall River, MA 02721 and is currently estimated at $486,801, approximately $271 per square foot. 370 Ludlow St is a home located in Bristol County with nearby schools including Letourneau Elementary School, Matthew J. Kuss Middle School, and B M C Durfee High School.
Ownership History
Date
Name
Owned For
Owner Type
Purchase Details
Closed on
May 31, 2000
Sold by
Cabral Timothy F
Bought by
Furtado Luis A and Furtado Marciana
Current Estimated Value
Home Financials for this Owner
Home Financials are based on the most recent Mortgage that was taken out on this home.
Original Mortgage
$139,650
Interest Rate
8.14%
Mortgage Type
Purchase Money Mortgage
Create a Home Valuation Report for This Property
The Home Valuation Report is an in-depth analysis detailing your home's value as well as a comparison with similar homes in the area
Home Values in the Area
Average Home Value in this Area
Purchase History
| Date | Buyer | Sale Price | Title Company |
|---|---|---|---|
| Furtado Luis A | $147,000 | -- |
Source: Public Records
Mortgage History
| Date | Status | Borrower | Loan Amount |
|---|---|---|---|
| Open | Furtado Luis A | $142,000 | |
| Closed | Furtado Luis A | $139,650 |
Source: Public Records
Tax History
| Year | Tax Paid | Tax Assessment Tax Assessment Total Assessment is a certain percentage of the fair market value that is determined by local assessors to be the total taxable value of land and additions on the property. | Land | Improvement |
|---|---|---|---|---|
| 2025 | $4,624 | $403,800 | $118,400 | $285,400 |
| 2024 | $4,139 | $360,200 | $116,100 | $244,100 |
| 2023 | $4,163 | $339,300 | $104,600 | $234,700 |
| 2022 | $3,661 | $290,100 | $98,700 | $191,400 |
| 2021 | $3,610 | $261,000 | $94,300 | $166,700 |
| 2020 | $3,516 | $243,300 | $90,000 | $153,300 |
| 2019 | $3,594 | $246,500 | $94,000 | $152,500 |
| 2018 | $3,468 | $237,200 | $94,700 | $142,500 |
| 2017 | $3,304 | $236,000 | $94,700 | $141,300 |
| 2016 | $3,134 | $229,900 | $97,600 | $132,300 |
| 2015 | $2,751 | $210,300 | $97,600 | $112,700 |
| 2014 | $2,646 | $210,300 | $97,600 | $112,700 |
Source: Public Records
Map
Nearby Homes
Your Personal Tour Guide
Ask me questions while you tour the home.